


Highlights
- FY25 revenue of PMV reached AUD 831.35 million, with net profit up 31.13% to AUD 338.22 million.
- Black Friday trading delivered record sales for Peter Alexander, supporting FY26 preparedness.
- H1FY26 underlying EBIT is expected to touch AUD 120 million, with the December-January trading window critical to first-half performance.
Premier Investments Limited (ASX:PMV), an Australia-based operator of specialty retail fashion chains across Australia, New Zealand, Asia, and Europe, delivered double digit growth in net profit attributable to shareholders in the 12 months ending 28 July 2025 (FY25).
FY25 Financial Performance
The company reported a 1.21% YoY increase in revenue to AUD 831.35 million, largely supported by record sales at its Peter Alexander brand. Other income increased to AUD 21.50 million in FY25 from AUD 1.38 million in FY24. Meanwhile, net profit attributable to members increased 31.13% to AUD 338.22 million, compared with AUD 257.92 million in the previous year.
Despite an increase in profitability, the company’s operating margin decreased to 20.3% in FY25 from 29.8% in FY24, and return on equity fell to 10.3%, below the industry median of 19.6%. Conversely, EBITDA margin reached 35.5% in FY25, well above the industry median of 14.4%, and the current ratio improved to 2.97x from 2.10x in the prior year.
Recent Developments and AGM Update
During its AGM on 5 December 2025, Premier Investments’ CEO noted that the company entered FY26 with a clean inventory position. Consumer caution and cost-of-living pressures remain factors influencing discretionary spending. However, Black Friday trading produced positive results, with Peter Alexander achieving record sales across the promotional period, reinforcing the brand’s performance in key sales windows.
Outlook for H1FY26
For the 26 weeks ending 24 January 2026, the company expects underlying EBIT (pre-AASB 16) of approximately AUD 120 million. The company’s management highlighted the importance of the December-January trading window, identifying it as a critical driver of first-half performance.
The company indicated that the group is well-positioned to capitalise on this period.
Constructive Indicators in Consumer Spending
Recent data from the Australian Bureau of Statistics (ABS) shows household spending increased 1.3% in October 2025, building on a 0.3% rise in September and marking the highest monthly gain since January 2024. Year-on-year, consumer spending is 5.6% higher.
In October 2025, all nine spending categories recorded increases, with Clothing and footwear (+3.5%), Furnishings and household equipment (+3.0%), and Hotels, cafés, and restaurants (+2.2%) leading gains.
Share Performance of PMV
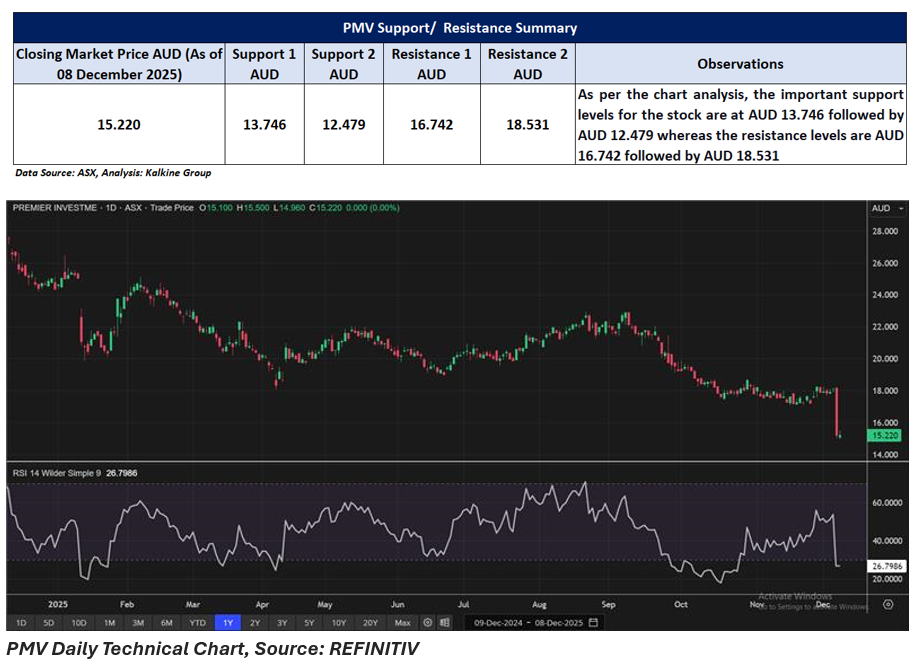
PMV shares closed at AUD 15.22 per share on 08 December 2025. The stock has declined 15.25% over the past week and is down 13.33% across the last month. PMV recorded 45.01% drop over the past year.
PMV’s 52-week high stands at AUD 27.95, recorded on 06 December 2024, while the 52-week low is AUD 15.01, reached on 05 December 2025.
Support and Resistance Summary
Note 1: Past performance is neither an Indicator nor a guarantee of future performance.
Note 2: The reference date for all price data, and currency, is 08 December 2025. The reference data in this report has been partly sourced from EODHD/Others.
Technical Indicators Defined:
Support: A level at which the stock prices tend to find support if they are falling, and a downtrend may take a pause backed by demand or buying interest. Support 1 refers to the nearby support level for the stock and if the price breaches the level, then Support 2 may act as the crucial support level for the stock.
Resistance: A level at which the stock prices tend to find resistance when they are rising, and an uptrend may take a pause due to profit booking or selling interest. Resistance 1 refers to the nearby resistance level for the stock and if the price surpasses the level, then Resistance 2 may act as the crucial resistance level for the stock.
Disclaimer
This article has been prepared by Kalkine Media, echoed on the website kalkinemedia.com/au and associated pages, based on the information obtained and collated from the subscription reports prepared by Kalkine Pty. Ltd. [ABN 34 154 808 312; AFSL no. 425376] on Kalkine.com.au (and associated pages). The principal purpose of the content is to provide factual information only for educational purposes. None of the content in this article, including any news, quotes, information, data, text, reports, ratings, opinions, images, photos, graphics, graphs, charts, animations, and video is or is intended to be, advisory in nature. The content does not contain or imply any recommendation or opinion intended to influence your financial decisions, including but not limited to, in respect of any particular security, transaction, or investment strategy, and must not be relied upon by you as such. The content is provided without any express or implied warranties of any kind. Kalkine Media, and its related bodies corporate, agents, and employees (Kalkine Group) cannot and do not warrant the accuracy, completeness, timeliness, merchantability, or fitness for a particular purpose of the content or the website, and to the extent permitted by law, Kalkine Group hereby disclaims any and all such express or implied warranties. Kalkine Group shall NOT be held liable for any investment or trading losses you may incur by using the information shared on our website.
