AUS
AUS
 NZ
NZ
 UK
UK
 CA
CA
 USA
USA
 IND
IND







Highlights
- Preliminary FY25 revenue of AVH reached approximately USD 71.6 million, reflecting year-over-year growth.
- Q4 FY25 net revenue stood at USD 17.6 million.
- FY26 revenue guidance maintained at USD 80–85 million.
- Gross profit declined YoY in Q3 FY25, but net loss narrowed.
- Cohealyx-I fully enrolled; PermeaDerm-I exceeded 75% enrolment.
AVITA Medical, Inc. (ASX:AVH), a regenerative medicine company focused on transforming wound care and skin restoration, provided a business update ahead of the J.P. Morgan Healthcare Conference. The company reported preliminary fourth-quarter FY25 (Q4 FY25) net revenue of approximately USD 17.6 million, lifting full-year FY25 revenue to around USD 71.6 million and reflecting year-over-year growth supported by continued commercial execution.
In addition, AVITA completed a refinancing of its existing debt through a five-year USD 60 million credit facility with Perceptive Advisors, strengthening its financial flexibility. The company reaffirmed its FY26 revenue guidance of USD 80–85 million.
Q3 FY25 Results Show Narrower Loss Despite Profit Pressure
For the quarter ended 30 September 2025 (Q3 FY25), AVITA reported a gross profit of USD 13.9 million, compared with USD 16.4 million in the prior-year period. The decline was attributed to softer revenue, margin pressure from product mix changes, and inventory adjustments.
Sales and marketing expenses decreased to USD 12.1 million from USD 15.1 million year-over-year, reflecting cost discipline. Meanwhile, net loss narrowed to USD 13.2 million from USD 16.2 million, supported by reduced operating expenses through organisational streamlining, lower personnel costs, and more efficient sales, administrative, and development activities.
Clinical Milestones Position Company for 2026 Data Readouts
Key clinical programs reached important enrollment milestones in December 2025. The Cohealyx-I study achieved full enrollment, while PermeaDerm-I surpassed 75% enrollment. Data from both studies are expected during 2026, with real-world evidence and multicenter trials indicating improved patient outcomes and hospital efficiencies.
Outlook
AVITA expects FY25 revenue in the range of USD 70–74 million and has guided FY26 revenue at USD 80–85 million. Improving reimbursement visibility and engagement across approximately 200 high-volume burn and trauma centers continue to support broader utilization and scalable adoption.
The company addresses an estimated USD 1.3 billion near-term market opportunity, with long-term U.S. potential exceeding USD 3.5 billion across burn, trauma, and surgical repair. The recently secured five-year credit facility underpins operations and includes defined 2026 revenue covenants.
Share Performance of AVH
AVH shares rose by 1.41% to close at AUD 1.08 per share on 16 January 2026. Over the past year, the stock has dropped 62.24%. It is down 21.17% over three months and 37.39% over six months, while gaining 7.46% week-to-date and 2.86% month-to-date and quarter-to-date. The 52-week high for AVH is AUD 3.380, recorded on 17 February 2025, and the 52-week low is AUD 1.000, reached on 8 January 2026.
Support and Resistance Summary
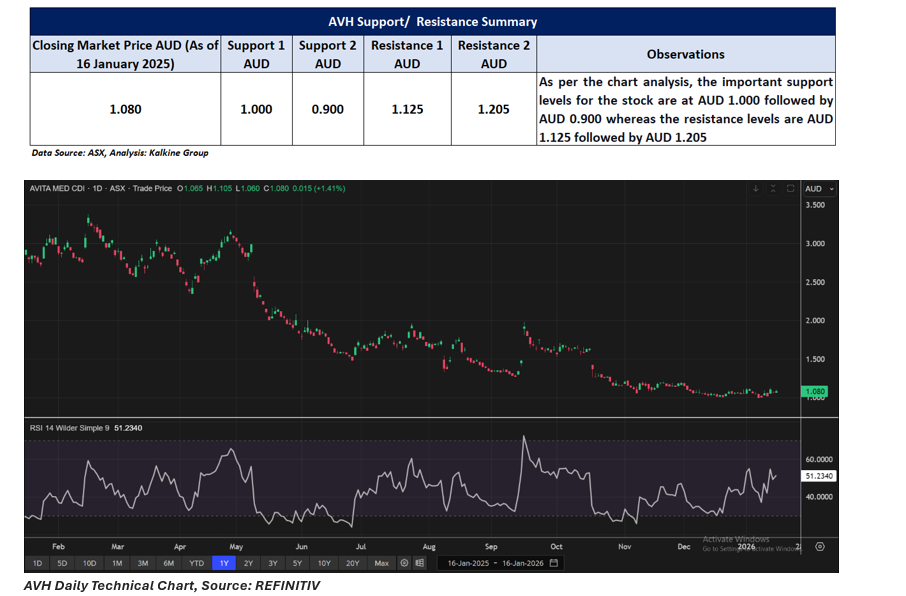
Note 1: Past performance is neither an Indicator nor a guarantee of future performance.
Note 2: The reference date for all price data, and currency, is 16 January 2026. The reference data in this report has been partly sourced from EODHD/Others.
Technical Indicators Defined:
Support: A level at which the stock prices tend to find support if they are falling, and a downtrend may take a pause backed by demand or buying interest. Support 1 refers to the nearby support level for the stock and if the price breaches the level, then Support 2 may act as the crucial support level for the stock.
Resistance: A level at which the stock prices tend to find resistance when they are rising, and an uptrend may take a pause due to profit booking or selling interest. Resistance 1 refers to the nearby resistance level for the stock and if the price surpasses the level, then Resistance 2 may act as the crucial resistance level for the stock.
Disclaimer
This article has been prepared by Kalkine Media, echoed on the website kalkinemedia.com/au and associated pages, based on the information obtained and collated from the subscription reports prepared by Kalkine Pty. Ltd. [ABN 34 154 808 312; AFSL no. 425376] on Kalkine.com.au (and associated pages). The principal purpose of the content is to provide factual information only for educational purposes. None of the content in this article, including any news, quotes, information, data, text, reports, ratings, opinions, images, photos, graphics, graphs, charts, animations, and video is or is intended to be, advisory in nature. The content does not contain or imply any recommendation or opinion intended to influence your financial decisions, including but not limited to, in respect of any particular security, transaction, or investment strategy, and must not be relied upon by you as such. The content is provided without any express or implied warranties of any kind. Kalkine Media, and its related bodies corporate, agents, and employees (Kalkine Group) cannot and do not warrant the accuracy, completeness, timeliness, merchantability, or fitness for a particular purpose of the content or the website, and to the extent permitted by law, Kalkine Group hereby disclaims any and all such express or implied warranties. Kalkine Group shall NOT be held liable for any investment or trading losses you may incur by using the information shared on our website.