
 AUS
AUS
 NZ
NZ
 UK
UK
 CA
CA
 USA
USA
 IND
IND








Highlights
- NEXTDC reported FY25 net revenue of AUD 350.2 million, up 13.7% year-on-year.
- Net assets increased to AUD 4,151.0 million as of June 30, 2025.
- Pro-forma contracted utilisation rose to 412MW following additional customer contract wins.
NEXTDC Limited (ASX:NXT), an Australia-listed Data Centre-as-a-Service provider, reported year-on-year growth in revenue and net assets in its yearly operating update for the 12 months ended June 2025 (FY25). The financial performance was supported by higher contracted utilisation, increased interconnection income, and continued development across its national and international data centre footprint.
Revenue Advances on Record Sales Year
For FY25, NEXTDC reported net revenue of AUD 350.2 million, compared with AUD 307.9 million in FY24, representing a year-on-year increase of 13.7%. The growth was driven by record sales year, underpinned by 42% lift in contracted utilisation to 244.8MW. Interconnection revenue rose 7% to AUD 30.2 million, accounting for 8.6% of total net revenue during the period.
Over the past five financial years, NEXTDC’s revenue has shown consistent upward movement, increasing from AUD 250.0 million in FY21 to AUD 460.7 million in FY25, according to company filings and market data.
Asset Base and Balance Sheet Position
NEXTDC’s net assets increased to AUD 4,151.0 million as of 30 June 2025, up from AUD 3,567.0 million in the prior year, reflecting a year-on-year rise of 16.4%.
As of June 30, 2025, net debt stood at approximately AUD 904.0 million, while gearing remained at 18%. Pro-forma liquidity increased by around AUD 2.8 billion to AUD 5.5 billion, providing funding capacity for ongoing development and contracted expansion projects.
Recent Business Developments
In December 2025, the company received State Significant Development approval from the New South Wales Department of Planning for its S4 Sydney Data Centre at Horsley Park, New South Wales.
During the same month, the company announced additional customer contract wins, lifting its pro-forma contracted utilisation by 96MW, or 30%, to 412MW compared with the previous update on December 1, 2025. These contract wins also increased the pro-forma forward order book to 301MW, which is expected to convert into billings, revenue, and EBITDA across FY26 to FY29.
Operating Metrics and Efficiency Trends
NEXTDC’s asset turnover ratio moderated to 0.08x in FY25, compared with 0.10x in FY24 and 0.11x in FY23. The asset-to-equity ratio declined to 1.37x in FY25 from 1.46x in FY24, indicating changes in capital structure over the period.
Cash cycle days remained negative at -107.6 days in FY25, compared with -78.2 days in FY24.
Outlook and Development Pipeline
NEXTDC’s development pipeline continues across S3 Sydney, M2 Melbourne, M3 Melbourne, and K1 Kuala Lumpur, with early works underway at S4 Sydney, S5 Sydney, and M4 Melbourne. Construction of S5 Sydney is expected to commence in FY26. For FY26, revenue is projected in the range of AUD 390 million to AUD 400 million, supported by a forward order book of 134MW and the conversion of contracted capacity.
Share Performance of NXT
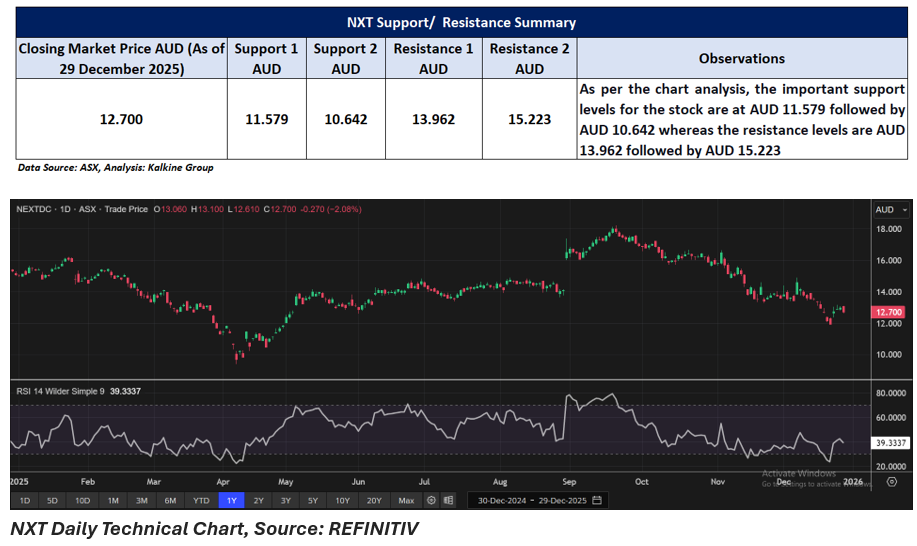
NXT shares closed 2.08% lower at AUD 12.70 per share on 29 December 2025. In the last three months, NXT’s share price dropped by around 26.80% and in a year, it has declined by almost 17.26%. Weekly gains stand at 6.37%.
52-week high of NXT is AUD 18.22, recorded on 19 September 2025 and 52-week low is AUD 9.40, recorded on 7 April 2025.
Support and Resistance Summary
Note 1: Past performance is neither an Indicator nor a guarantee of future performance.
Note 2: The reference date for all price data, and currency, is 29 December 2025. The reference data in this report has been partly sourced from EODHD/Others.
Technical Indicators Defined:
Support: A level at which the stock prices tend to find support if they are falling, and a downtrend may take a pause backed by demand or buying interest. Support 1 refers to the nearby support level for the stock and if the price breaches the level, then Support 2 may act as the crucial support level for the stock.
Resistance: A level at which the stock prices tend to find resistance when they are rising, and an uptrend may take a pause due to profit booking or selling interest. Resistance 1 refers to the nearby resistance level for the stock and if the price surpasses the level, then Resistance 2 may act as the crucial resistance level for the stock.
Disclaimer
This article has been prepared by Kalkine Media, echoed on the website kalkinemedia.com/au and associated pages, based on the information obtained and collated from the subscription reports prepared by Kalkine Pty. Ltd. [ABN 34 154 808 312; AFSL no. 425376] on Kalkine.com.au (and associated pages). The principal purpose of the content is to provide factual information only for educational purposes. None of the content in this article, including any news, quotes, information, data, text, reports, ratings, opinions, images, photos, graphics, graphs, charts, animations, and video is or is intended to be, advisory in nature. The content does not contain or imply any recommendation or opinion intended to influence your financial decisions, including but not limited to, in respect of any particular security, transaction, or investment strategy, and must not be relied upon by you as such. The content is provided without any express or implied warranties of any kind. Kalkine Media, and its related bodies corporate, agents, and employees (Kalkine Group) cannot and do not warrant the accuracy, completeness, timeliness, merchantability, or fitness for a particular purpose of the content or the website, and to the extent permitted by law, Kalkine Group hereby disclaims any and all such express or implied warranties. Kalkine Group shall NOT be held liable for any investment or trading losses you may incur by using the information shared on our website.
