
 AUS
AUS
 NZ
NZ
 UK
UK
 CA
CA
 USA
USA
 IND
IND


_01_06_2026_11_37_05_749645.png)





Highlights
- PEXA Group’s FY25 revenue increased 16% YoY to AUD 393.6 million, while NPATA declined 6% YoY to AUD 41.1 million.
- Free cash flow grew 45% YoY to AUD 56 million in FY25, enabling AUD 53.1 million net debt repayment and AUD 18.9 million share buyback.
- FY26 guidance targets revenue of AUD 405-430 million and EBITDA margin of 32-35%, with strategic focus on UK expansion and platform resilience.
PEXA Group Limited (ASX:PXA), a leading provider of digital property settlement platforms in Australia, reported total group revenue of AUD 393.6 million for the full year ended 30 June 2025 (FY25). This represents a 16% increase compared to AUD 340.1 million in the prior year. Gross profit in FY25 rose 25% year-on-year to AUD 17.7 million. However, group NPATA declined by 6% YoY to AUD 41.1 million, impacted by higher depreciation, amortisation, and tax expenses.
Improved Cash Generation and Capital Management
The company reported a 45% increase in free cash flow, reaching AUD 56 million, driven by higher operating earnings and reduced capital expenditure. This improved cash position enabled PEXA to repay AUD 53.1 million in net debt and execute an AUD 18.9 million share buyback during FY25.
Recent Corporate Developments
Through an ASX update dated 25 November 2025, PEXA shared that it has appointed Tony Ristevski as Group Chief Financial Officer, effective 1 June 2026. Mr. Ristevski brings over 20 years of senior finance leadership experience, most recently serving as CFO of ASX-listed WEB Travel Group Limited.
Quarterly Performance
In the first quarter of FY26 (1QFY26), total transaction volumes on the PEXA Exchange increased by 6% year-on-year to 1,055,000. Transfer volumes rose 3%, while refinances surged 16%, supported by consecutive cash rate cuts by the Reserve Bank of Australia. The platform maintained a 90% national market penetration and expanded refinance functionality into the Northern Territory. Customer satisfaction improved to 88.3% in 1QFY26 from 87.5% in the prior quarter. PEXA remains on track to deliver its AML solution ahead of the July 2026 regulatory deadline and has submitted its pricing review to IPART.
Outlook and Strategic Focus
PEXA is focusing on accelerating the adoption of its UK platform following a market launch in September and October, engaging stakeholders including HM Land Registry, legal practitioners, financial institutions, and prop-tech providers. The UK government’s goal of a fully digitised property transactions market positions PEXA as a central player in this transformation, as stated by the company.
For FY26, PEXA guides group revenue in the range of AUD 405 million to AUD 430 million, with an expected EBITDA margin between 32% and 35%. Group NPAT is forecasted to be between AUD 5 million and AUD 15 million, alongside planned capital expenditure of AUD 60 million to AUD 65 million.
Key priorities for FY26 include improving cybersecurity, enhancing platform resilience, and progressing regulatory engagement.
Share Performance of PXA
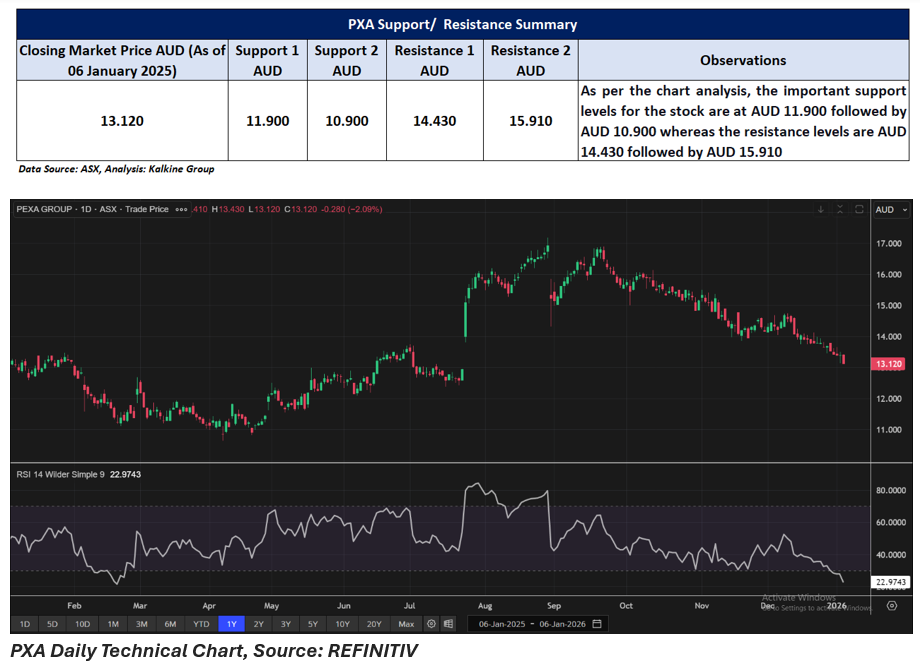
PXA shares fell 2.09% to close at AUD 13.120 per share on 6 January 2025. Over the past year, the stock saw minimal growth of 0.08%. It has declined by 9.27% over the last month and 3.03% in the past week, though it recorded a 16.52% gain over the last nine months. The 52-week high for PXA was AUD 17.180, achieved on 28 August 2025, while the 52-week low was AUD 10.650, set on 7 April 2025.
Support and Resistance Summary
Note 1: Past performance is neither an Indicator nor a guarantee of future performance.
Note 2: The reference date for all price data, and currency, is 06 January 2026. The reference data in this report has been partly sourced from EODHD/Others.
Technical Indicators Defined:
Support: A level at which the stock prices tend to find support if they are falling, and a downtrend may take a pause backed by demand or buying interest. Support 1 refers to the nearby support level for the stock and if the price breaches the level, then Support 2 may act as the crucial support level for the stock.
Resistance: A level at which the stock prices tend to find resistance when they are rising, and an uptrend may take a pause due to profit booking or selling interest. Resistance 1 refers to the nearby resistance level for the stock and if the price surpasses the level, then Resistance 2 may act as the crucial resistance level for the stock.
Disclaimer
This article has been prepared by Kalkine Media, echoed on the website kalkinemedia.com/au and associated pages, based on the information obtained and collated from the subscription reports prepared by Kalkine Pty. Ltd. [ABN 34 154 808 312; AFSL no. 425376] on Kalkine.com.au (and associated pages). The principal purpose of the content is to provide factual information only for educational purposes. None of the content in this article, including any news, quotes, information, data, text, reports, ratings, opinions, images, photos, graphics, graphs, charts, animations, and video is or is intended to be, advisory in nature. The content does not contain or imply any recommendation or opinion intended to influence your financial decisions, including but not limited to, in respect of any particular security, transaction, or investment strategy, and must not be relied upon by you as such. The content is provided without any express or implied warranties of any kind. Kalkine Media, and its related bodies corporate, agents, and employees (Kalkine Group) cannot and do not warrant the accuracy, completeness, timeliness, merchantability, or fitness for a particular purpose of the content or the website, and to the extent permitted by law, Kalkine Group hereby disclaims any and all such express or implied warranties. Kalkine Group shall NOT be held liable for any investment or trading losses you may incur by using the information shared on our website.
