
 AUS
AUS
 NZ
NZ
 UK
UK
 CA
CA
 USA
USA
 IND
IND








Highlights
- In FY25, GYG’s global network sales increased 23.0% to AUD 1,180.7 million, supported by 39 new restaurant openings.
- EBITDA rose 45.5% to AUD 65.1 million in FY25, driven by drive-thru formats, operational efficiency, and international growth.
- FY26 plans include 32 new restaurants with a focus on franchising, margin improvement, and US market expansion.
Guzman y Gomez Ltd (ASX:GYG), an ASX-listed Quick Service Restaurant (QSR) brand, recorded increases across key business metrics in its financial results for the full year ended 30 June 2025 (FY25). Global network sales climbed 23.0% year-over-year to AUD 1,180.7 million, supported by the opening of 39 new restaurants and higher comparable sales. EBITDA for the period rose by 45.5% YoY to AUD 65.1 million, driven by high-margin drive-thru formats, operational efficiencies, and expanding international operations, particularly in the United States, Australia, and Singapore. Cash and cash equivalents also increased significantly, reaching AUD 39.7 million, up 142.1% compared to the previous year.
Recent Business Developments Highlight Operational Progress
In its 1QFY26 update released on 9 October 2025, the company announced an 18.6% year-over-year increase in global network sales to AUD 330.6 million. This was supported by continued comparable sales growth and the launch of five new restaurants. The company has implemented nationwide digital chicken temperature monitoring and enhanced recipe systemisation to improve operational performance. By the end of the quarter, 23 restaurants were operating 24/7, with new menu items added to the Caesar range. The US segment also showed sales growth with one additional restaurant opening. The company announced an AUD 100 million on-market share buyback during this period.
In a recent substantial holding update dated 29 December 2025, State Street Corporation and its subsidiaries reduced their voting power from 9.54% to 8.47%.
Strategic Plans for FY26 Focus on Expansion and Margin Growth
Looking ahead, the company plans to open 32 new restaurants in FY26, with 60% expected to be franchised outlets. The expansion aims to strengthen the company’s Australian footprint while accelerating growth in the US, especially in the Chicago area.
The company expects Australia’s underlying EBITDA margin as a percentage of network sales to increase to between 5.9% and 6.3% in FY26, compared to 5.7% in FY25. Continued margin expansion is anticipated through improved operating leverage, with a target of approximately 10% EBITDA margin over the next five years.
Focus on US Growth and Consumer Trends
In FY26, the company intends to grow US sales through investments in operational improvements, labour efficiency, and enhancing the guest experience. Menu innovation and promotional campaigns, including new Caesar menu items, are expected to support comparable sales growth and sales momentum.
Share Performance of GYG
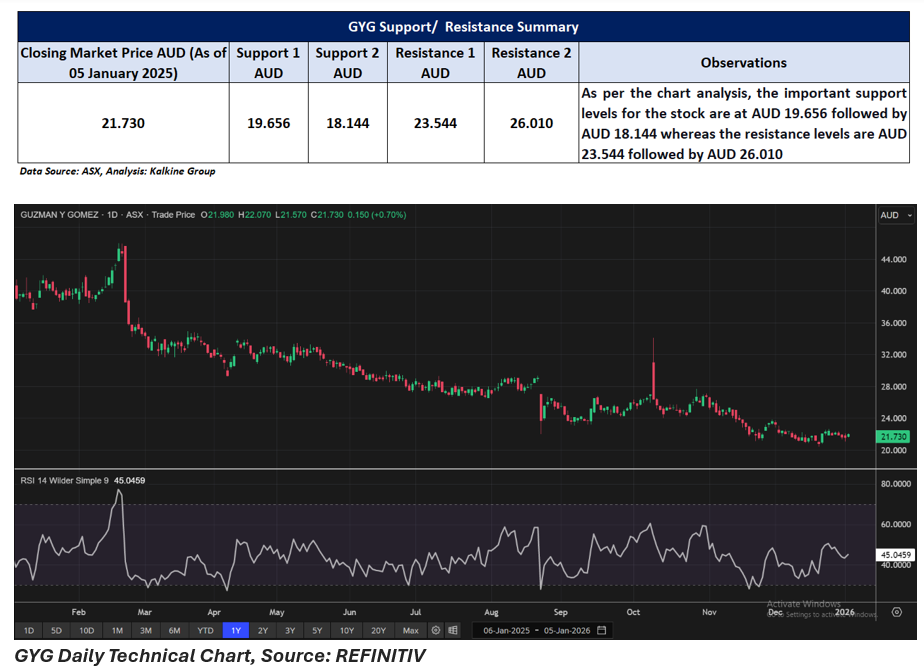
GYG shares closed at AUD 21.730, gaining 0.70% intraday with a net increase of AUD 0.150. However, the stock has experienced a significant decline over the last year, dropping 45.62%. It also fell 2.16% over the past week and 2.60% over the past month. The stock’s three-month, six-month, and nine-month declines stand at 17.72%, 24.10%, and 27.57%, respectively.
The 52-week high for GYG was AUD 45.990 on 19 February 2025, while the 52-week low was AUD 20.430, recorded on 18 December 2025.
Support and Resistance Summary
Note 1: Past performance is neither an Indicator nor a guarantee of future performance.
Note 2: The reference date for all price data, and currency, is 05 January 2026. The reference data in this report has been partly sourced from EODHD/Others.
Technical Indicators Defined:
Support: A level at which the stock prices tend to find support if they are falling, and a downtrend may take a pause backed by demand or buying interest. Support 1 refers to the nearby support level for the stock and if the price breaches the level, then Support 2 may act as the crucial support level for the stock.
Resistance: A level at which the stock prices tend to find resistance when they are rising, and an uptrend may take a pause due to profit booking or selling interest. Resistance 1 refers to the nearby resistance level for the stock and if the price surpasses the level, then Resistance 2 may act as the crucial resistance level for the stock.
Disclaimer
This article has been prepared by Kalkine Media, echoed on the website kalkinemedia.com/au and associated pages, based on the information obtained and collated from the subscription reports prepared by Kalkine Pty. Ltd. [ABN 34 154 808 312; AFSL no. 425376] on Kalkine.com.au (and associated pages). The principal purpose of the content is to provide factual information only for educational purposes. None of the content in this article, including any news, quotes, information, data, text, reports, ratings, opinions, images, photos, graphics, graphs, charts, animations, and video is or is intended to be, advisory in nature. The content does not contain or imply any recommendation or opinion intended to influence your financial decisions, including but not limited to, in respect of any particular security, transaction, or investment strategy, and must not be relied upon by you as such. The content is provided without any express or implied warranties of any kind. Kalkine Media, and its related bodies corporate, agents, and employees (Kalkine Group) cannot and do not warrant the accuracy, completeness, timeliness, merchantability, or fitness for a particular purpose of the content or the website, and to the extent permitted by law, Kalkine Group hereby disclaims any and all such express or implied warranties. Kalkine Group shall NOT be held liable for any investment or trading losses you may incur by using the information shared on our website.
