
 AUS
AUS
 NZ
NZ
 UK
UK
 CA
CA
 USA
USA
 IND
IND








Highlights
- In FY25, SIG’s revenue increased to AUD 6.0 billion and EBIT rose to AUD 767.9 million
- Retail and wholesale network expanded to nearly 900 stores
- FY26 opened with continued sales momentum
Sigma Healthcare Limited (ASX:SIG), an ASX-listed company engaged in marketing, retailing, wholesaling, and distributing pharmaceutical, medical, healthcare, and beauty products, reported a significant increase in revenue and earnings for the financial year ended 30 June 2025 (FY25), supported by the merger with Chemist Warehouse.
Sales revenue for the period rose to AUD 6,001.8 million, compared with AUD 3,294.4 million in FY24. EBIT increased to AUD 767.9 million, up from AUD 581.5 million in the prior year.
Revenue growth was driven by the expansion of Sigma’s retail and wholesale footprint to nearly 900 stores and approximately 3,000 pharmacy customers. Like-for-like sales across the Australian Chemist Warehouse network increased 11.3%, supported by continued demand across beauty, vitamins, supplements, and GLP-1 products. International expansion into New Zealand, Ireland, and the UAE, along with the launch of the Wagner generics range, also contributed to growth.
Business Updates and Early FY26 Momentum
In November 2025, a director increased her indirect shareholding through an on-market purchase, investing AUD 31,237. At the October 2025 annual general meeting, the company reported that momentum from the fourth quarter of FY25 continued into FY26. For the first quarter of FY26, total Chemist Warehouse network sales rose 17.9%, with like-for-like sales increasing 14.7%, supported by broad-based category performance and higher GLP-1 sales contribution.
Outlook and Integration Focus
Sigma expects the continued rollout of Chemist Warehouse, Amcal, and Discount Drug Stores across domestic and international markets. Integration activities are ongoing, with synergy benefits targeted from FY27 onward and an annual synergy target of AUD 100 million. The company remains focused on operational efficiency, supply chain optimisation, and working capital management to support growth.
Share Performance of SIG
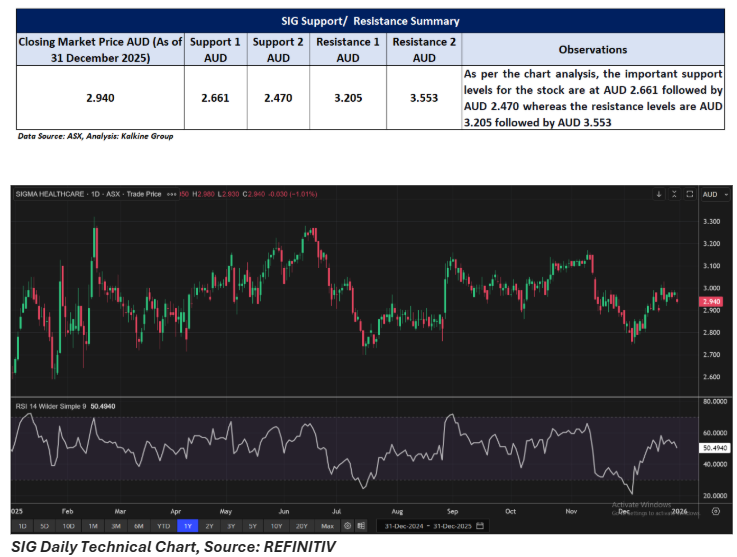
SIG shares slipped 1.01% to close at AUD 2.940 per share on 31 December 2025. On a yearly basis, the stock has recorded a gain of 12.21%. It has declined 1.34% over the past week and is down 1.01% over the past three months, while falling 1.67% over six months.
SIG reached a 52-week high of AUD 3.320 on 17 February 2025, while the 52-week low of AUD 2.590 was recorded on 23 January 2025.
Support and Resistance Summary
Note 1: Past performance is neither an Indicator nor a guarantee of future performance.
Note 2: The reference date for all price data, and currency, is 31 December 2025. The reference data in this report has been partly sourced from EODHD/Others.
Technical Indicators Defined:
Support: A level at which the stock prices tend to find support if they are falling, and a downtrend may take a pause backed by demand or buying interest. Support 1 refers to the nearby support level for the stock and if the price breaches the level, then Support 2 may act as the crucial support level for the stock.
Resistance: A level at which the stock prices tend to find resistance when they are rising, and an uptrend may take a pause due to profit booking or selling interest. Resistance 1 refers to the nearby resistance level for the stock and if the price surpasses the level, then Resistance 2 may act as the crucial resistance level for the stock.
Disclaimer
This article has been prepared by Kalkine Media, echoed on the website kalkinemedia.com/au and associated pages, based on the information obtained and collated from the subscription reports prepared by Kalkine Pty. Ltd. [ABN 34 154 808 312; AFSL no. 425376] on Kalkine.com.au (and associated pages). The principal purpose of the content is to provide factual information only for educational purposes. None of the content in this article, including any news, quotes, information, data, text, reports, ratings, opinions, images, photos, graphics, graphs, charts, animations, and video is or is intended to be, advisory in nature. The content does not contain or imply any recommendation or opinion intended to influence your financial decisions, including but not limited to, in respect of any particular security, transaction, or investment strategy, and must not be relied upon by you as such. The content is provided without any express or implied warranties of any kind. Kalkine Media, and its related bodies corporate, agents, and employees (Kalkine Group) cannot and do not warrant the accuracy, completeness, timeliness, merchantability, or fitness for a particular purpose of the content or the website, and to the extent permitted by law, Kalkine Group hereby disclaims any and all such express or implied warranties. Kalkine Group shall NOT be held liable for any investment or trading losses you may incur by using the information shared on our website.
