
 AUS
AUS
 NZ
NZ
 UK
UK
 CA
CA
 USA
USA
 IND
IND

_12_18_2025_13_10_52_739003.png)





Highlights
- CRN’s total revenue declined 28.2% YoY to USD 1,399.3 million for the nine months ended 30 September 2025
- During the reported period, net cash from operating activities rose to USD 54.9 million from USD 11.5 million
- Saleable production increased 21% quarter-on-quarter, reaching its highest level since Q1 FY21
- Stanwell transaction announced to strengthen near- and long-term liquidity.
Coronado Global Resources, Inc. (ASX:CRN) is an Australia-based producer of metallurgical coal with operations across Australia and the United States. The company operates within the GICS® Metals & Mining industry and the Steel sub-industry.
Financial Performance: Nine Months Ended 30 September 2025
For the nine-month period ended 30 September 2025, the company reported total revenues of USD 1,399.3 million, down from USD 1,950.2 million in the corresponding prior period, reflecting a year-on-year decline of 28.2%.
Net cash generated from operating activities increased 377.4% YoY to USD 54.9 million, compared with USD 11.5 million in the previous period. Total costs and expenses declined to USD 1,632.0 million from USD 1,982.7 million, representing a 17.7% reduction YoY.
Key Drivers Behind Revenue Decline
The decrease in revenue was primarily driven by lower production at U.S. operations due to temporary surface mine idling and reduced yields. Additional factors included rail, port and pier constraints in the United States, as well as co-shipment scheduling delays in Australia.
Operational Performance and Production Update
Despite these challenges, production performance improved during the period. Higher equipment utilisation, an expanded owner-operated fleet at the open-cut mine, and the continued ramp-up of the Mammoth underground mine in Australia supported improved output.
In its quarterly update for the period ended 30 September 2025, the company reported growth across key metrics. Saleable production rose 21% to its highest level since Q1 FY21, while sales volumes increased 9%. ROM production improved by 6%. Ongoing investments in new operations delivered a 3.2 million tonne annualised production uplift from Q2 to Q3, reflecting progress toward steady-state performance.
Strategic and Corporate Developments
On 28 October 2025, Coronado Global Resources announced a proposed transaction with Stanwell, aimed at strengthening both near-term and long-term financial viability.
Separately, the company disclosed that UBS Group AG and its related bodies corporate became a substantial holder, acquiring 5.30% of the company’s voting rights, effective 31 October 2025.
Outlook
The company reiterated confidence in its high-quality, long-life asset base and strategically located operations, supported by established customer relationships in high-growth markets. Its strategy remains focused on safe and efficient operations, disciplined cash management, liquidity preservation, and maintaining optionality through the downturn.
The proposed Stanwell transaction, once completed, is expected to enhance near-term liquidity through a USD 265 million asset-based lending facility. Combined with ongoing production and productivity improvements, this is expected to support long-term supply arrangements and contribute to positive momentum into the fourth quarter.
Share Performance of CRN
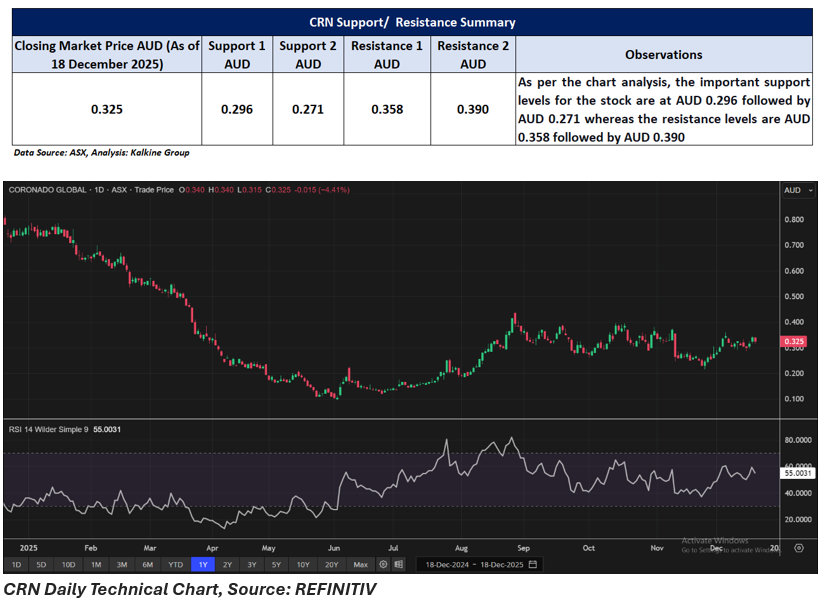
CRN shares fell 4.41% to close at AUD 0.325 per share on 18 December 2025. Over the past year, the stock has declined 58.33%. Despite the longer-term weakness, the shares have risen 3.17% over the past week and advanced 30.00% over the past month. Over the past three months, however, the stock is down 12.16%, while it has gained 132.14% over the last six months. The stock’s 52-week high stands at AUD 0.885, recorded on 16 December 2024, while the 52-week low of AUD 0.100 was reached on 3 June 2025.
Support and Resistance Summary
Note 1: Past performance is neither an Indicator nor a guarantee of future performance.
Note 2: The reference date for all price data, and currency, is 18 December 2025. The reference data in this report has been partly sourced from EODHD/Others.
Technical Indicators Defined:
Support: A level at which the stock prices tend to find support if they are falling, and a downtrend may take a pause backed by demand or buying interest. Support 1 refers to the nearby support level for the stock and if the price breaches the level, then Support 2 may act as the crucial support level for the stock.
Resistance: A level at which the stock prices tend to find resistance when they are rising, and an uptrend may take a pause due to profit booking or selling interest. Resistance 1 refers to the nearby resistance level for the stock and if the price surpasses the level, then Resistance 2 may act as the crucial resistance level for the stock.
Disclaimer
This article has been prepared by Kalkine Media, echoed on the website kalkinemedia.com/au and associated pages, based on the information obtained and collated from the subscription reports prepared by Kalkine Pty. Ltd. [ABN 34 154 808 312; AFSL no. 425376] on Kalkine.com.au (and associated pages). The principal purpose of the content is to provide factual information only for educational purposes. None of the content in this article, including any news, quotes, information, data, text, reports, ratings, opinions, images, photos, graphics, graphs, charts, animations, and video is or is intended to be, advisory in nature. The content does not contain or imply any recommendation or opinion intended to influence your financial decisions, including but not limited to, in respect of any particular security, transaction, or investment strategy, and must not be relied upon by you as such. The content is provided without any express or implied warranties of any kind. Kalkine Media, and its related bodies corporate, agents, and employees (Kalkine Group) cannot and do not warrant the accuracy, completeness, timeliness, merchantability, or fitness for a particular purpose of the content or the website, and to the extent permitted by law, Kalkine Group hereby disclaims any and all such express or implied warranties. Kalkine Group shall NOT be held liable for any investment or trading losses you may incur by using the information shared on our website.
