
 AUS
AUS
 NZ
NZ
 UK
UK
 CA
CA
 USA
USA
 IND
IND


_12_30_2025_13_06_25_947851.png)





Highlights
- Lindsay Australia’s group operating revenue rose 5.7% year-on-year to AUD 850 million in FY25.
- Rural EBITDA increased 10.3% to AUD 10 million, while underlying NPAT declined 26.6% to AUD 22.3 million.
- Integration of acquisitions and new infrastructure developments, including the Hazelmere terminal, are central to FY26 growth plans.
Lindsay Australia Ltd (ASX:LAU), a company specialising in integrated transport, logistics, and rural supply services, recorded revenue growth in the financial year 2025 (FY25) despite pressure on profitability due to rising input costs and softer consumer demand.
Revenue Growth Driven by Transport and Rural Segments
The company’s group operating revenue increased by 5.7% to AUD 850 million in FY25, up from AUD 804 million the previous year. This growth was primarily supported by the transport and rural divisions, underpinned by recent acquisitions. The rural business showed a notable improvement with rural EBITDA rising 10.3% year-on-year to AUD 10 million. Despite the increase in revenue, underlying EBITDA declined 12% to AUD 81 million, affected by rising input costs and a decline in consumer demand across key markets. The company’s underlying net profit after tax (NPAT) also fell by 26.6% to AUD 22.3 million compared to the previous fiscal year.
Acquisition Integration and Operational Efficiency Focus
In FY25, Lindsay Australia made progress with its acquisition strategy, integrating newly acquired businesses to enhance service capabilities and operational reach. The merger of SRT with Lindsay has advanced well, yielding early benefits such as shared resources, expanded service offerings, and enhanced operational leadership. More than 400 new employees have been added to support these expanded operations. Additionally, LAU is focusing on value extraction from its acquisition of GJ Freight and plans to address capacity constraints by launching the new Hazelmere terminal in Perth.
Financial Ratios and Risks
The company reported a gross margin of 73.3% in FY25, considerably higher than the industry median of 30.6%. The company’s current ratio stood at 1.35 times compared to the industry median of 0.97, indicating better short-term liquidity. However, EBITDA margin contracted from 13.4% in FY24 to 11.7% in FY25, and the debt-to-equity ratio increased to 2.06x from 1.65x, reflecting higher leverage.
Share Performance of LAU
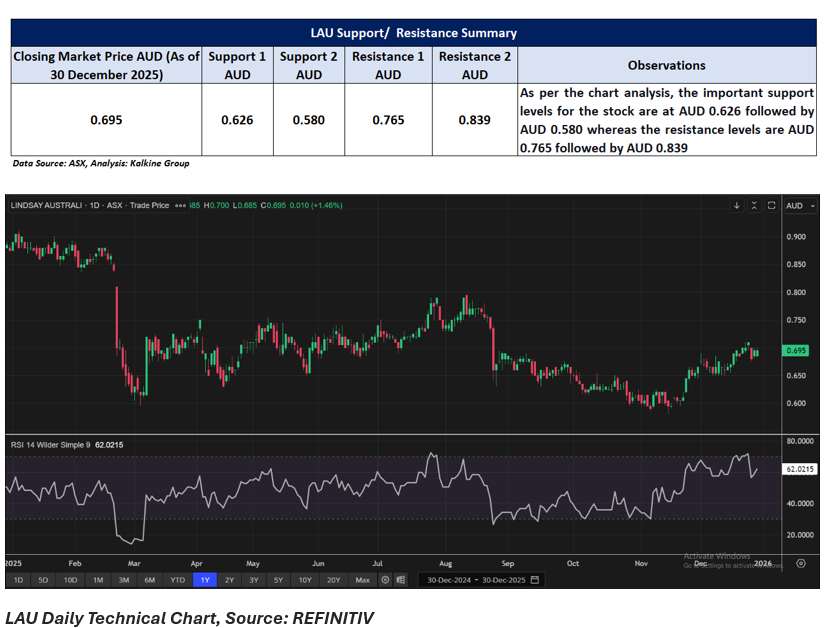
LAU shares rose 1.46% intraday to close at AUD 0.695 per share on 30 December 2025. Over the past year, the stock has declined by 21.47%, while year-to-date losses stand at 20.57%. The share price is down 1.42% over the past week and has slipped 6.08% over six months, with a 3.47% decline over nine months. In contrast, the stock has shown gains over shorter periods, rising 4.51% over the past month and 6.11% over the last three months.
The 52-week high for LAU is AUD 0.910, recorded on 6 January 2025, while the 52-week low stands at AUD 0.580, reached on 14 November 2025.
Support and Resistance Summary
Note 1: Past performance is neither an Indicator nor a guarantee of future performance.
Note 2: The reference date for all price data, and currency, is 30 December 2025. The reference data in this report has been partly sourced from EODHD/Others.
Technical Indicators Defined:
Support: A level at which the stock prices tend to find support if they are falling, and a downtrend may take a pause backed by demand or buying interest. Support 1 refers to the nearby support level for the stock and if the price breaches the level, then Support 2 may act as the crucial support level for the stock.
Resistance: A level at which the stock prices tend to find resistance when they are rising, and an uptrend may take a pause due to profit booking or selling interest. Resistance 1 refers to the nearby resistance level for the stock and if the price surpasses the level, then Resistance 2 may act as the crucial resistance level for the stock.
Disclaimer
This article has been prepared by Kalkine Media, echoed on the website kalkinemedia.com/au and associated pages, based on the information obtained and collated from the subscription reports prepared by Kalkine Pty. Ltd. [ABN 34 154 808 312; AFSL no. 425376] on Kalkine.com.au (and associated pages). The principal purpose of the content is to provide factual information only for educational purposes. None of the content in this article, including any news, quotes, information, data, text, reports, ratings, opinions, images, photos, graphics, graphs, charts, animations, and video is or is intended to be, advisory in nature. The content does not contain or imply any recommendation or opinion intended to influence your financial decisions, including but not limited to, in respect of any particular security, transaction, or investment strategy, and must not be relied upon by you as such. The content is provided without any express or implied warranties of any kind. Kalkine Media, and its related bodies corporate, agents, and employees (Kalkine Group) cannot and do not warrant the accuracy, completeness, timeliness, merchantability, or fitness for a particular purpose of the content or the website, and to the extent permitted by law, Kalkine Group hereby disclaims any and all such express or implied warranties. Kalkine Group shall NOT be held liable for any investment or trading losses you may incur by using the information shared on our website.
