
 AUS
AUS
 NZ
NZ
 UK
UK
 CA
CA
 USA
USA
 IND
IND


_01_15_2026_13_14_25_687281.png)




Highlights
- Ingenia Communities reported FY25 revenue of AUD 517.7 million, up 9.6% year on year, while EBIT increased 21.9% to AUD 164.1 million.
- Operating cash flow rose more than 75% year on year to AUD 145.2 million, supported by home settlements, rent increases, and higher holiday park occupancy.
- The company guided FY26 EBIT in the range of AUD 180.5–188.7 million, with growth plans including new greenfield developments and continued portfolio expansion.
Ingenia Communities Group (ASX:INA), an ASX-listed operator, owner, and developer of affordable rental and holiday communities for seniors, has reported encouraging growth for the full year ended 30 June 2025 (FY25). The company operates 100 communities under Ingenia Lifestyle, Gardens, Holidays, and Rental segments, continuing expansion through acquisitions and development projects.
In FY25, the comapny achieved revenue of AUD 517.7 million, up 9.6% from FY24, while EBIT rose 21.9% to AUD 164.1 million. Net tangible assets per security increased 6% to AUD 3.9. Meanwhile, operating cash flow surged over 75% YoY to AUD 145.2 million in FY25.
Growth Driven by Settlements, Rent Increases, and Holiday Performance
Top-line growth was supported by 520 home settlements, an 11% surge in average home prices, and CPI-linked rent rises. The Holidays segment also posted higher revenue, benefiting from increased rates and occupancy.
Profit gains were underpinned by development margins, recurring rental income, cost control, and selective portfolio recycling.
Recent Business Updates and Capital Movements
At the AGM, the company confirmed that its FY26 trading aligned with its Five-Year Plan. Key operational highlights include:
- Gardens community occupancy at 96%
- All-age rental occupancy exceeding 99%
- Resident engagement of 79% in Land Lease communities and 85% in Gardens
- Forward holiday park bookings up 12% year on year
- 166 development settlements completed, with 418 contracts held
FY26 Outlook
The company has provided guidance for FY26 with EPS expected between 32.5–34.0 cents and EBIT projected at AUD 180.5–188.7 million. Growth plans include:
- Five new greenfield projects to boost residential development, settlements and Lifestyle annuity rentals
- Continued densification and strategic acquisitions in the Holidays segment
- Stable earnings from recurring revenue in Lifestyle, Rental, and Gardens segments
The company’s strategy leverages Australia’s aging population, housing affordability pressures, and migration trends, positioning it to capture demand for affordable retirement and rental communities while maintaining recurring cash flows.
Share Performance of INA
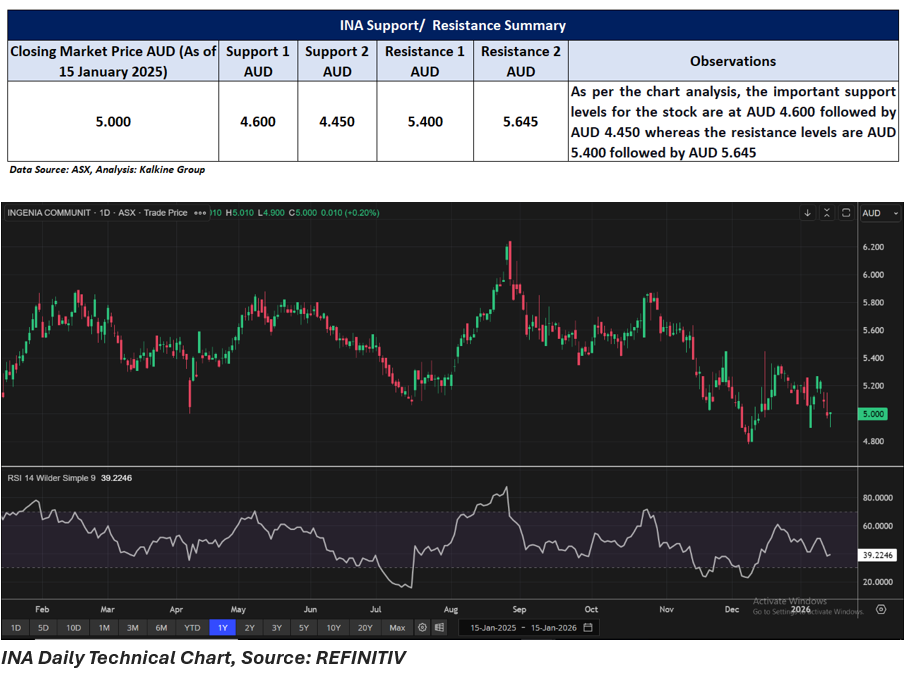
INA shares closed at AUD 5.000 per share on 15 January 2026, up 0.20% intraday. The stock has experienced a decline of 2.34% over the past year and has fallen by 10.39% and 5.84% over the last three and six months respectively. Over the past week, the share price dropped by 2.34%. Additionally, the stock has declined by 2.15% over the last month. The 52-week high for INA is AUD 6.240, set on 27 August 2025, while the 52-week low is AUD 4.500, recorded on 13 January 2025.
Support and Resistance Summary
Note 1: Past performance is neither an Indicator nor a guarantee of future performance.
Note 2: The reference date for all price data, and currency, is 15 January 2026. The reference data in this report has been partly sourced from EODHD/Others.
Technical Indicators Defined:
Support: A level at which the stock prices tend to find support if they are falling, and a downtrend may take a pause backed by demand or buying interest. Support 1 refers to the nearby support level for the stock and if the price breaches the level, then Support 2 may act as the crucial support level for the stock.
Resistance: A level at which the stock prices tend to find resistance when they are rising, and an uptrend may take a pause due to profit booking or selling interest. Resistance 1 refers to the nearby resistance level for the stock and if the price surpasses the level, then Resistance 2 may act as the crucial resistance level for the stock.
Disclaimer
This article has been prepared by Kalkine Media, echoed on the website kalkinemedia.com/au and associated pages, based on the information obtained and collated from the subscription reports prepared by Kalkine Pty. Ltd. [ABN 34 154 808 312; AFSL no. 425376] on Kalkine.com.au (and associated pages). The principal purpose of the content is to provide factual information only for educational purposes. None of the content in this article, including any news, quotes, information, data, text, reports, ratings, opinions, images, photos, graphics, graphs, charts, animations, and video is or is intended to be, advisory in nature. The content does not contain or imply any recommendation or opinion intended to influence your financial decisions, including but not limited to, in respect of any particular security, transaction, or investment strategy, and must not be relied upon by you as such. The content is provided without any express or implied warranties of any kind. Kalkine Media, and its related bodies corporate, agents, and employees (Kalkine Group) cannot and do not warrant the accuracy, completeness, timeliness, merchantability, or fitness for a particular purpose of the content or the website, and to the extent permitted by law, Kalkine Group hereby disclaims any and all such express or implied warranties. Kalkine Group shall NOT be held liable for any investment or trading losses you may incur by using the information shared on our website.
