
 AUS
AUS
 NZ
NZ
 UK
UK
 CA
CA
 USA
USA
 IND
IND


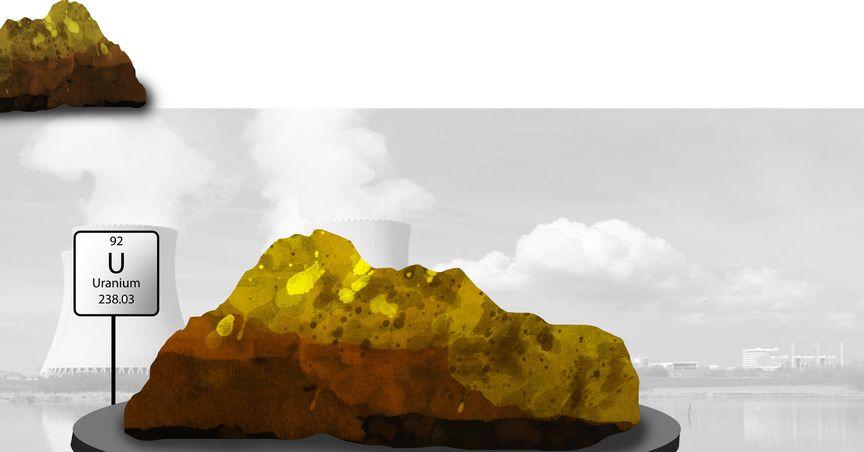




Highlights
- In FY25, production exceeded guidance, delivering 872,000 lbs of U3O8 against an 850,000 lbs target.
- C1 cash costs of AUD 35/lb beat forecasted AUD 37–41/lb, with year-end liquidity of AUD 224.3 million and zero debt.
- FY26 Honeymoon output expected at 1.6M lbs U3O8 with C1 cash costs of AUD 41–45/lb, fully funded from cash and inventory.
Boss Energy Ltd (ASX:BOE), a uranium mining company with operations in Australia and the United States, has reported that production exceeded guidance in the financial year 2025 (FY25). The company delivered 872,000 lbs of U3O8 against an 850,000 lbs target, achieving positive free cash flow in its inaugural operating year. C1 cash costs came in at AUD 35/lb, below the forecasted AUD 37–41/lb range.
Despite a AUD 34.2 million after-tax loss, largely due to non-cash inventory valuation adjustments and plant commissioning costs, the company ended FY25 with AUD 224.3 million in cash and liquid assets and zero debt. Net operating cash inflows from initial uranium output were AUD 17.4 million.
In FY25, BOE’s revenue reached AUD 75.596 million and investments & other liquid assets stood at AUD 51.637 million, reflecting 45% YoY rise.
Quarterly Output and Infrastructure Updates
The September 2025 quarterly report highlighted record output at the Honeymoon Uranium Project in South Australia, with 385,910 lbs of U3O8 produced, up 11% from the June quarter. C1 cash costs were AUD 34/lb, below FY26 guidance. Sales and loan repayments totalled AUD 57.1 million at an average realised price of AUD 114.3/lb.
The company continued to expand processing infrastructure and wellfields, including NIMCIX column installation. Exploration progressed at Honeymoon and the Alta Mesa Texas joint venture, yielding new mineralisation and additional land tenure. Year-end uranium inventory stood at 1.44 million lbs.
FY26 Guidance and Strategic Focus
The company reaffirmed its FY26 guidance despite withdrawing the 2021 EFS. The company expects Honeymoon output of 1.6 million lbs of U3O8, with C1 cash costs of AUD 41–45/lb and all-in sustaining costs (AISC) of AUD 64–70/lb. Total capex for the ramp-up, estimated at AUD 56–62 million and it will be fully funded from existing cash and inventory.
The company’s strategic focus includes optimizing Honeymoon operations via a New Feasibility Study for wide-spaced wellfields, completing delineation drilling (55,000 metres) and a new JORC resource model by Q3CY26. Boss Energy is also advancing satellite deposits such as Goulds Dam and Jasons and progressing the Alta Mesa JV in the US, using liquid assets to self-fund growth and diversify production.
Share Performance of BOE
BOE closed at AUD 1.560 per share on 14 January 2026, with an intraday gain of 2.97%. The stock has faced a significant one-year decline of 43.27% and a six-month drop of 58.95%. It has also fallen 37.10% over nine months and 18.96% over the past three months. The 52-week high was AUD 4.750 on 27 June 2025, while the 52-week low was AUD 1.070 on 18 December 2025.
Support and Resistance Summary
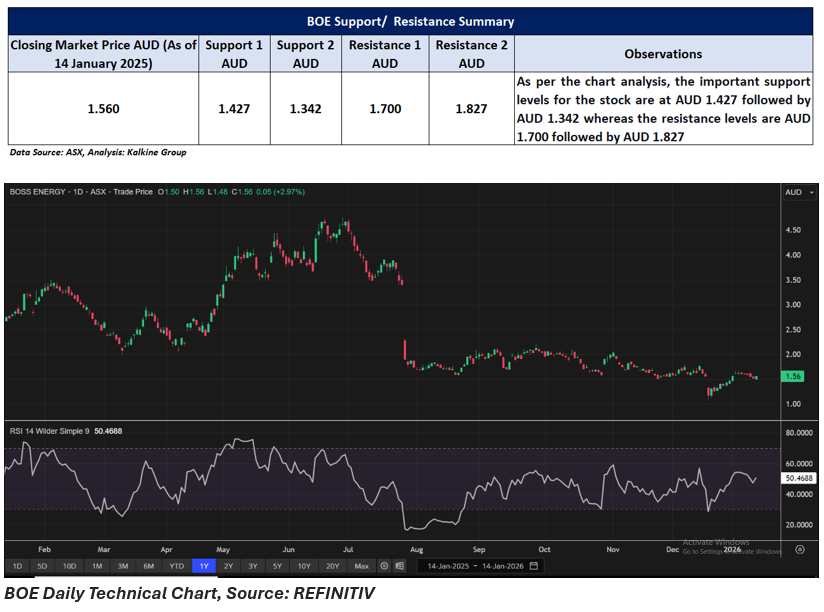
Note 1: Past performance is neither an Indicator nor a guarantee of future performance.
Note 2: The reference date for all price data, and currency, is 14 January 2026. The reference data in this report has been partly sourced from EODHD/Others.
Technical Indicators Defined:
Support: A level at which the stock prices tend to find support if they are falling, and a downtrend may take a pause backed by demand or buying interest. Support 1 refers to the nearby support level for the stock and if the price breaches the level, then Support 2 may act as the crucial support level for the stock.
Resistance: A level at which the stock prices tend to find resistance when they are rising, and an uptrend may take a pause due to profit booking or selling interest. Resistance 1 refers to the nearby resistance level for the stock and if the price surpasses the level, then Resistance 2 may act as the crucial resistance level for the stock.
Disclaimer
This article has been prepared by Kalkine Media, echoed on the website kalkinemedia.com/au and associated pages, based on the information obtained and collated from the subscription reports prepared by Kalkine Pty. Ltd. [ABN 34 154 808 312; AFSL no. 425376] on Kalkine.com.au (and associated pages). The principal purpose of the content is to provide factual information only for educational purposes. None of the content in this article, including any news, quotes, information, data, text, reports, ratings, opinions, images, photos, graphics, graphs, charts, animations, and video is or is intended to be, advisory in nature. The content does not contain or imply any recommendation or opinion intended to influence your financial decisions, including but not limited to, in respect of any particular security, transaction, or investment strategy, and must not be relied upon by you as such. The content is provided without any express or implied warranties of any kind. Kalkine Media, and its related bodies corporate, agents, and employees (Kalkine Group) cannot and do not warrant the accuracy, completeness, timeliness, merchantability, or fitness for a particular purpose of the content or the website, and to the extent permitted by law, Kalkine Group hereby disclaims any and all such express or implied warranties. Kalkine Group shall NOT be held liable for any investment or trading losses you may incur by using the information shared on our website.
