
 AUS
AUS
 NZ
NZ
 UK
UK
 CA
CA
 USA
USA
 IND
IND








Highlights
- NXL’s total revenue increased 0.4% YoY to AUD 221.5 million in FY25.
- Annualised Contract Value (ACV) rose 8% to AUD 228.4 million as of 30 June 2025.
- Cash and cash equivalents improved by 4.9% to AUD 39.9 million in FY25.
Nuix Limited (ASX:NXL) provides investigative analytics and intelligence software designed to help customers uncover truth in the digital world. The company facilitates the efficient collection, processing, and review of large volumes of structured and unstructured data, catering to diverse investigative and compliance needs.
FY25 financial performance
For the full year ended 30 June 2025 (FY25), the company reported total statutory revenue of AUD 221.5 million, up 0.4% from AUD 220.6 million in the prior year. The company noted that multi-year deals accounted for 27% of revenue, a decrease from 31% in FY24. Annualised Contract Value (ACV), which better reflects recurring revenue, grew 8% YoY to AUD 228.4 million (as of 30 June 2025).
Nuix also highlighted growth in its Nuix Neo platform, with ACV rising 132% to AUD 28.1 million. Discover SaaS ACV grew 17.3%, while Subscription ACV increased 10.1% to AUD 221.2 million, representing 97% of total ACV. Despite these gains, the company reported a negative return on equity of 3.2% and a reported loss of AUD 9.2 million for FY25. However, cash EBITDA improved by 24.5% compared to the previous year.
Cash position and balance sheet
Cash and cash equivalents rose 4.9% to AUD 39.9 million as of 30 June 2025, up from AUD 38.0 million a year earlier. The balance sheet remained on track, with AUD 40.0 million in year-end cash and an undrawn AUD 30 million debt facility.
Key business development
On 3 December 2025, the company entered into an agreement to acquire Linkurious, a Paris-based AI decision platform founded in 2013. Linkurious enables customers to visually explore and analyze graph data to detect patterns and investigate alerts. This acquisition is expected to enhance Nuix’s innovation roadmap by adding advanced graph technology and data visualization capabilities.
Outlook
Nuix’s strategic outlook includes leveraging the Linkurious acquisition to improve its ability to deliver scalable insights from complex data using graph-native capabilities and link analysis technology. The company anticipates that this will expand distribution, accelerate innovation, and create both immediate and long-term customer value.
Financially, Nuix remains focused on business transformation and accelerating growth through its Nuix Neo platform. The company emphasizes securing larger contracts to capture increasing data volumes and new analytical opportunities. ACV growth is expected to be driven by Nuix Neo, with revenue projected to outpace operating costs and underlying cash flow expected to remain positive.
Share Performance of NXL
NXL shares fell 1.89% to close at AUD 1.820 per share on 17 December 2025. Over the past year, the stock has declined sharply by 70.50%. Losses have also been recorded across shorter timeframes, with 1.89% drop over the past week, and 6.67% over the past month. The downturn has been more pronounced over longer periods, with declines of 30.80% over three months, 19.47% over six months, and 43.48% over nine months.
The stock’s 52-week high stands at AUD 6.595, reached on 7 January 2025, while the 52-week low is AUD 1.720, recorded on 21 November 2025.
Support and Resistance Summary
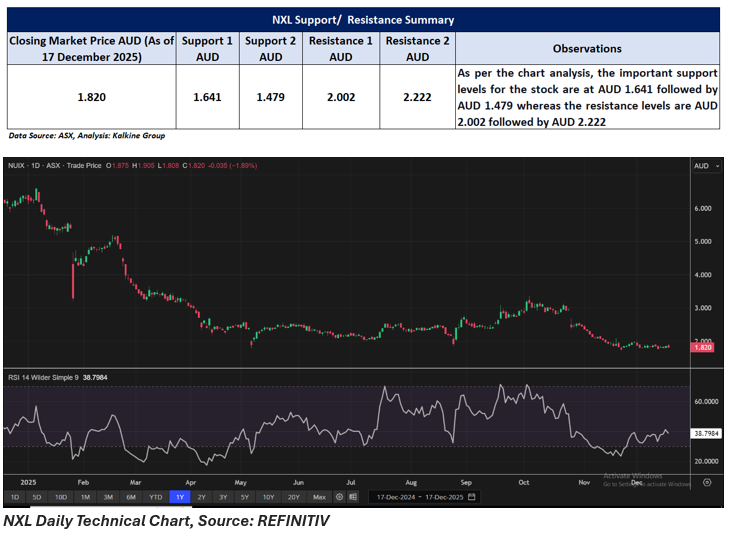
Note 1: Past performance is neither an Indicator nor a guarantee of future performance.
Note 2: The reference date for all price data, and currency, is 17 December 2025. The reference data in this report has been partly sourced from EODHD/Others.
Technical Indicators Defined:
Support: A level at which the stock prices tend to find support if they are falling, and a downtrend may take a pause backed by demand or buying interest. Support 1 refers to the nearby support level for the stock and if the price breaches the level, then Support 2 may act as the crucial support level for the stock.
Resistance: A level at which the stock prices tend to find resistance when they are rising, and an uptrend may take a pause due to profit booking or selling interest. Resistance 1 refers to the nearby resistance level for the stock and if the price surpasses the level, then Resistance 2 may act as the crucial resistance level for the stock.
Disclaimer
This article has been prepared by Kalkine Media, echoed on the website kalkinemedia.com/au and associated pages, based on the information obtained and collated from the subscription reports prepared by Kalkine Pty. Ltd. [ABN 34 154 808 312; AFSL no. 425376] on Kalkine.com.au (and associated pages). The principal purpose of the content is to provide factual information only for educational purposes. None of the content in this article, including any news, quotes, information, data, text, reports, ratings, opinions, images, photos, graphics, graphs, charts, animations, and video is or is intended to be, advisory in nature. The content does not contain or imply any recommendation or opinion intended to influence your financial decisions, including but not limited to, in respect of any particular security, transaction, or investment strategy, and must not be relied upon by you as such. The content is provided without any express or implied warranties of any kind. Kalkine Media, and its related bodies corporate, agents, and employees (Kalkine Group) cannot and do not warrant the accuracy, completeness, timeliness, merchantability, or fitness for a particular purpose of the content or the website, and to the extent permitted by law, Kalkine Group hereby disclaims any and all such express or implied warranties. Kalkine Group shall NOT be held liable for any investment or trading losses you may incur by using the information shared on our website.
