
 AUS
AUS
 NZ
NZ
 UK
UK
 CA
CA
 USA
USA
 IND
IND


_11_10_2025_12_42_52_194970.png)





Highlights
- As of 30 september 2025, GQG’s total funds under management were USD 167.2 billion.
- GQG’s performance fees declined 29.2% year-on-year due to lower relative investment returns.
- The company’s net operating income rose 12.3% year-on-year to USD 306.8 million in H1 FY25.
GQG Partners Inc (ASX:GQG) is an asset management firm that manages equity portfolios for clients, including pension funds, sovereign wealth funds, wealth managers, and institutional investors.
Financial Update
For the first half of financial year 2025 (H1 FY25), GQG Partners reported net revenue of USD 403 million, up 10.99% from USD 363.1 million in H1 FY24, driven by higher net inflows and market appreciation. Net operating income rose 12.3% YoY to USD 306.8 million in H1 FY25 from USD 273 million in H1 FY24 and operating margin reached 76.1% despite increase in compensation and distribution costs. The average management fee rate decreased slightly due to changes in product and client mix, and performance fees fell USD 5.7 million YoY due to lower relative investment returns in H1 FY25. Net income attributable to shareholders increased 14.4% YoY to USD 230.2 million in H1 FY25 from USD 201 million in H1 FY24. The Board declared an interim dividend of USD 0.0356 per share, reflecting a 90% payout ratio.
Bsuiness Update
On 16 October 2025, GQG Partners announced a quarterly dividend of USD 0.037 per share (AUD 0.0568), representing 90% of estimated distributable earnings for Q3 2025, with an ex-dividend date of 21 October, record date of 22 October, and payment on 17 December.
As of 30 September 2025, the firm managed USD 167.2 billion in assets, reporting net outflows of USD 1.7 billion in September and USD 4.8 billion for the quarter, partly offset by USD 3.2 bn net inflows year-to-date, down from USD 17.4 bn over the same period in 2024. Management cited defensive portfolio positioning amid high market valuations and macro uncertainty, highlighting capital preservation as a priority and noting that management fees remain the main revenue source.
Key Positives and Negatives
In H1 FY25, operating expenses rose by 7.1% YoY, primarily due to higher compensation, and performance fees declined by 29.2% YoY because of lower relative investment returns.
Business Outlook
GQG Partners expects FUM levels to recover following net outflows of USD 1.7 billion in September and USD 4.8 billion in Q3, as market conditions stabilise and investment performance adjusts. Portfolios remain defensively positioned due to high market valuations and ongoing macroeconomic uncertainty, with regular reviews to manage risk and preserve client capital. The firm plans to expand into new distribution channels, including ETFs and retail managed accounts, and diversify its product range to support future FUM growth.
Share Performance of GQG
GQG’s shares were trading at AUD 1.470 per share on 10 November 2025 with an intraday gain of 2.44%. GQG’s stock is down 18.33% in last three months, 39.75% down over the six months, and declined 47.31% over the past year. GQG’s 52-week high is AUD 2.850, recorded on 11 November 2024 and 52-week low is AUD 1.425, recorded on 06 November 2025.
Support and Resistance Summary
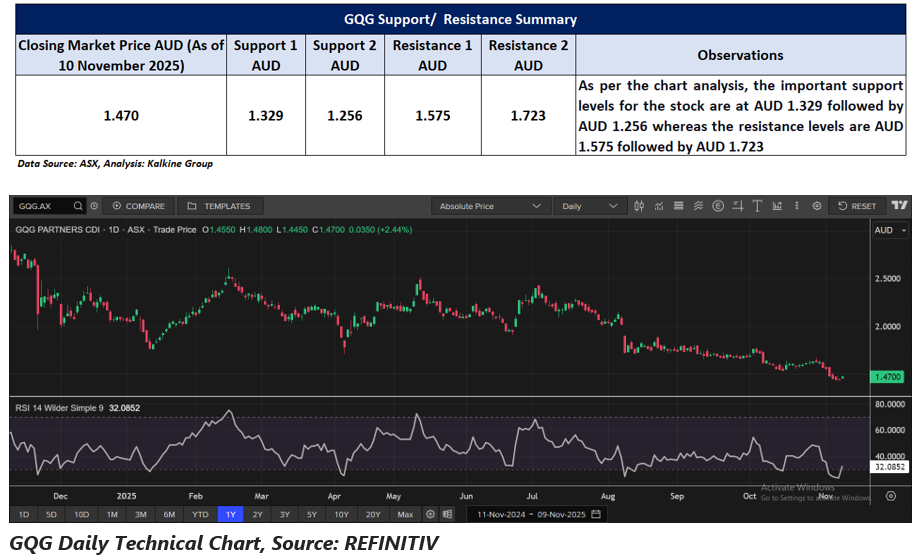
Note 1: Past performance is neither an Indicator nor a guarantee of future performance.
Note 2: The reference date for all price data, and currency, is 10 November 2025. The reference data in this report has been partly sourced from EODHD/Others.
Technical Indicators Defined:
Support: A level at which the stock prices tend to find support if they are falling, and a downtrend may take a pause backed by demand or buying interest. Support 1 refers to the nearby support level for the stock and if the price breaches the level, then Support 2 may act as the crucial support level for the stock.
Resistance: A level at which the stock prices tend to find resistance when they are rising, and an uptrend may take a pause due to profit booking or selling interest. Resistance 1 refers to the nearby resistance level for the stock and if the price surpasses the level, then Resistance 2 may act as the crucial resistance level for the stock.
Disclaimer
This article has been prepared by Kalkine Media, echoed on the website kalkinemedia.com/au and associated pages, based on the information obtained and collated from the subscription reports prepared by Kalkine Pty. Ltd. [ABN 34 154 808 312; AFSL no. 425376] on Kalkine.com.au (and associated pages). The principal purpose of the content is to provide factual information only for educational purposes. None of the content in this article, including any news, quotes, information, data, text, reports, ratings, opinions, images, photos, graphics, graphs, charts, animations, and video is or is intended to be, advisory in nature. The content does not contain or imply any recommendation or opinion intended to influence your financial decisions, including but not limited to, in respect of any particular security, transaction, or investment strategy, and must not be relied upon by you as such. The content is provided without any express or implied warranties of any kind. Kalkine Media, and its related bodies corporate, agents, and employees (Kalkine Group) cannot and do not warrant the accuracy, completeness, timeliness, merchantability, or fitness for a particular purpose of the content or the website, and to the extent permitted by law, Kalkine Group hereby disclaims any and all such express or implied warranties. Kalkine Group shall NOT be held liable for any investment or trading losses you may incur by using the information shared on our website.
