


_02_06_2025_07_05_23_538703.jpg)

What are Bond-Proxy Stocks?
Bond-proxies refer to investment areas that represent similar characteristics to a bond in terms of low-risk income with higher yields. The popularity of bond proxies came into picture when they tend to outperform the market at time of uncertainty about economic growth among investors. However, as per few media sources, it has been found that bond proxies may not always remain popular, as the company needs to have strong fundamentals and resilience against rising interest rates and inflation.
Investment in bond proxies has increasingly become a favourable option for investors who are aiming at regular income. They have some characteristics similar to infrastructure stocks and real estate investment trusts, whose revenue does not see much impact from economic downturns due to contracts of long duration along with their natural monopolies over essential services. Hence, such stocks have the potential to offer stable earnings and revenue streams for the investors.
Let us delve into some of the ASX-listed bond proxy stocks.
Transurban Group
Transurban Group (ASX: TCL) is engaged in the building and operation of toll roads.
Change in Directorsâ Interest: The company recently released multiple notifications regarding the change in interest of directors. The directors transacting in the securities included Louis Scott Charlton, Robert John Edgar, Peter Brooke Scott, Neil Gregory Chatfield, Mark Birrell, Lindsay Philip Maxsted, Jane Wilson and Christine Elizabeth OâReilly.
Security Purchase Plan: TCL also announced that it raised an amount of $312 million through a security purchase plan. The company would issue approximately 21.3 million SPP securities at an issue price of $14.64 per security.
FY19 Highlights: During the year ended 30 June 2019, the company reported a statutory profit of $170 million. Average daily traffic during the year grew by 2.0% and proportional toll revenue increased to $2,581 million, representing an increase of 10.3%. Proportional EBITDA for the year amounted to $2,016 million, increasing at a rate of 12.3% in comparison to the previous year. The period was marked by a free cash flow amounting to $1,527 million. For the six months ended 30 June 2019, the company paid a distribution of 30.0 cents per share on 09 August 2019.
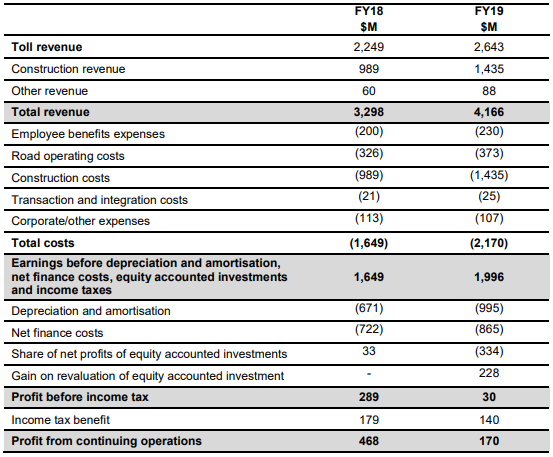
Statutory Results (Source: Company Reports)
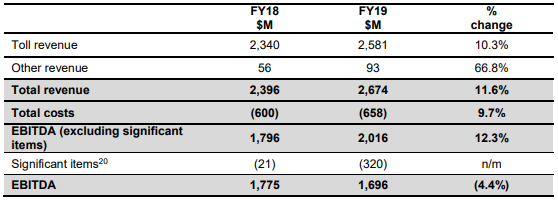
Proportional Results (Source: Company Reports)
Network Performance:
- In Sydney, proportional toll revenue increased by 10.4% to $1,042 million and EBITDA grew by 12.2%.
- In Melbourne, the company reported proportional toll revenue of $813 million, increased by 4.2% on the previous year. EBITDA from the region increased by 4.0%.
- Brisbaneâs proportional toll revenue stood at $402 million, representing an increase of 2.3%. EBITDA increased by 5.4%.
- In North America, the companyâs proportional toll revenue was reported at $324 million, rising 45.0% on the previous year. EBITDA grew by 61.1%
Outlook: The company has provided FY20 distribution guidance of 62.0 cents per security including 4.0 cents per security fully franked.
Stock Performance: The stock of the company generated negative returns of 4.69% and 1.63% over a period of 1 month and 3 months, respectively. The stock closed the dayâs trading at a market price of $14.170, down 1.87% on 11 September 2019.
Mirvac Group
Mirvac Group (ASX: MGR) is engaged in real estate investment, development, third party capital management and property asset management.
Change in Directorsâ Interest: The company recently notified about the change in interest of directors including Peter Stanley Nash, Samantha Joy Mostyn and Susan Lloyd-Hurwitz.
FY19 Results: During the year, the groupâs operating profit was reported at $631 million, representing an increase of 4% on the operating profit of $608 million in the prior corresponding period. Full year contributions increased to $440 million, representing 11.6 cents paid per stapled security. The distribution amounted reflected an increase of 5% on prior year. Group Return on Invested Capital during the year was reported at 10.1%. During the year, strong net property revaluation uplifts were realised, across the investment portfolio of $516 million. The company reported earnings per share at 17.1 cents per stapled security, representing growth of 4% on prior corresponding period. Over the past six years, the company has delivered eight new modern office buildings and five industrial buildings with an end value of $2.7 billion. Sale of secondary and non-core assets over the past six year period stood at $2.9 billion.
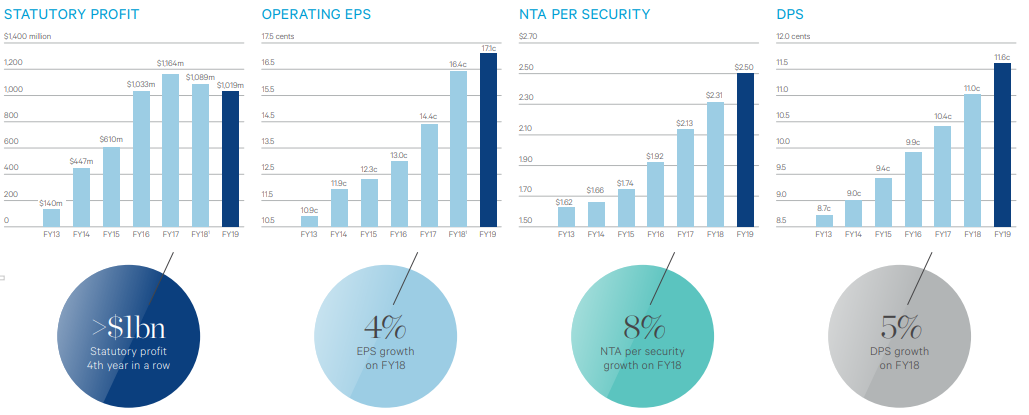
Growth Trajectory (Source: Company Presentation)
Vision:
- The company is now progressing towards the construction of an active commercial pipeline of $3.1 billion.
- It is expected to deliver development EBIT of over $130 million and fair value uplift of $200 million between FY20 and FY22.
- In addition, the company expects to deliver more than 2,500 residential settlements in FY20, supported by solid residential pre-sales of $1.7 billion and residential EBIT of 79%.
- Over the period covering FY19 to FY21, the company is targeting 5% average annual growth in passive earnings.
- In addition, the business is on track to deliver active EBIT of approximately $1 billion over the said period.
FY20 Guidance: In FY20, the company is expecting EPS to be in the range of 17.6 cpss â 17.8 cpss, representing EPS growth in the range of 3% - 4%. Dividend per share for the year is expected to grow at a rate of 5%.
Stock Performance: The stock of the company generated negative returns of 6.13% and 3.47% over a period of 1 month and 3 months, respectively. The stock closed the dayâs trading at a market price of $3.010, down 1.634% on 11 September 2019 and has a market capitalisation of $12.04 billion.
Sydney Airport
Sydney Airport (ASX: SYD) is part of the industrial sector and is engaged in airport operations.
Julyâ19 Traffic Performance:
- In the month of July, 3.85 million passengers passed through Sydney Airport, down 1.2% on July 2018.
- The number of domestic passengers travelling through the airport, reduced by 0.7% to 2.39 million.
- International passengers travelling through the airport went down by a higher rate of 2.2%, from 1.49 million in July 2018 to 1.46 million in July 2019.
Year-to-Date Performance:
- Total passengers travelling through the airport were reported at 25.45 million, down 0.3% in comparison to 25.54 million as per YTD-18.
- Number of domestic passengers reduced by 1.3%, from 15.9 million in YTD-18 to 15.69 million in YTD-19.
- International passengers traveling through the airport were reported at 9.76 million in YTD-19, representing an increase of 1.3% in comparison to 9.64 million in YTD-18.
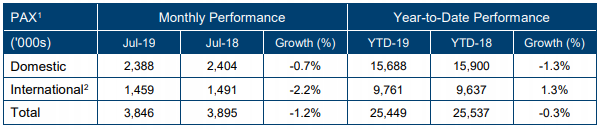
Traffic Performance (Source: Company Reports)
Other Highlights: In August 2019, the company welcomed Malindo Air to Sydney Airport and saw the inaugural of Sydney flight by Malindo Air. It commenced the daily service to Kuala Lumpur via Denpasar that added 120k seats annually. Qantas announced an addition of three return flights per week between Sydney and Santiago, further adding 20,000 seats to the route from late June 2020 annually.
 1H19 Performance: During the six months ended 30 June 2019, the company reported revenue amounting to $797.1 million, up 3.4% on pcp. Net operating receipts for the period stood at $431.2 million, rising 4.8% on prior corresponding period. Operating expenses during the period were reported at $101.2 million, down 1.4% on pcp. During the period, the company reported EBITDA amounting to $649.2 million, representing an increase of 4.1% on prior corresponding period.
Guidance: The company has provided a distribution guidance of 39.0 cents per stapled security for 2019. Capital expenditure for the year is expected to be between $300 million and $350 million. In addition, the company has forecast a three-year capex amount of $0.9 billion - $1.1 billion, over the period covering 2019-2021.
Stock Performance: The stock of the company generated returns of 8.84% over a period of six months and has a market capitalisation of $18.07 billion. The stock closed the dayâs trading at a market price of $7.950, down 0.625% on 11 September 2019.
Disclaimer
This website is a service of Kalkine Media Pty. Ltd. A.C.N. 629 651 672. The website has been prepared for informational purposes only and is not intended to be used as a complete source of information on any particular company. Kalkine Media does not in any way endorse or recommend individuals, products or services that may be discussed on this site. Our publications are NOT a solicitation or recommendation to buy, sell or hold. We are neither licensed nor qualified to provide investment advice.
