


Highlights
- In H1 FY24, OTB saw 11% increase in group revenue to GBP 80.8 million, driven by a 22% rise in group bookings
- The company’s adjusted EBITDA surged by 93% to GBP 8.1 million in H1 FY24, compared to pcp
- The company paid an interim dividend of GBX 0.9 per share on June 28, 2024
On The Beach Group PLC (LSE: OTB) is one of the UK’s leading online retailers of beach holidays. The company operates through three segments: CCH, OTB, and CPH. It has a market capitalization of GBP 248.16mn and is listed on the FTSE All-Share index.
In H1FY24, the company’s group revenue rose by 11% to GBP 80.8 million compared to GBP 72.9 million in pcp. This increase was driven by a 22% rise in group bookings. Additionally, adjusted EBITDA increased sharply by 93% to GBP 8.1 million, up from GBP 4.2 million in pcp.
Moreover, in the same reporting period, OTB had a higher gross margin of 71.8% and a lower debt/equity ratio of 0.34x, compared to the industry average of 67.2%, and 0.69x, respectively.
Recent business update
On May 11, 2024, the company declared an interim dividend of GBX 0.9 per share. It was paid on 28 June 2024.
Company outlook
As per the company, its trading momentum has continued to show robust performance following the mid-year point. As of Summer '24, forward orders total transaction value (TTV) is notably 22% higher compared to the previous year. Backed with these positive indicators and bolstered by the new partnership with Ryanair, the company anticipates another strong summer season. The Board expresses confidence in achieving a fiscal year 2024 profit that aligns with current consensus expectations.
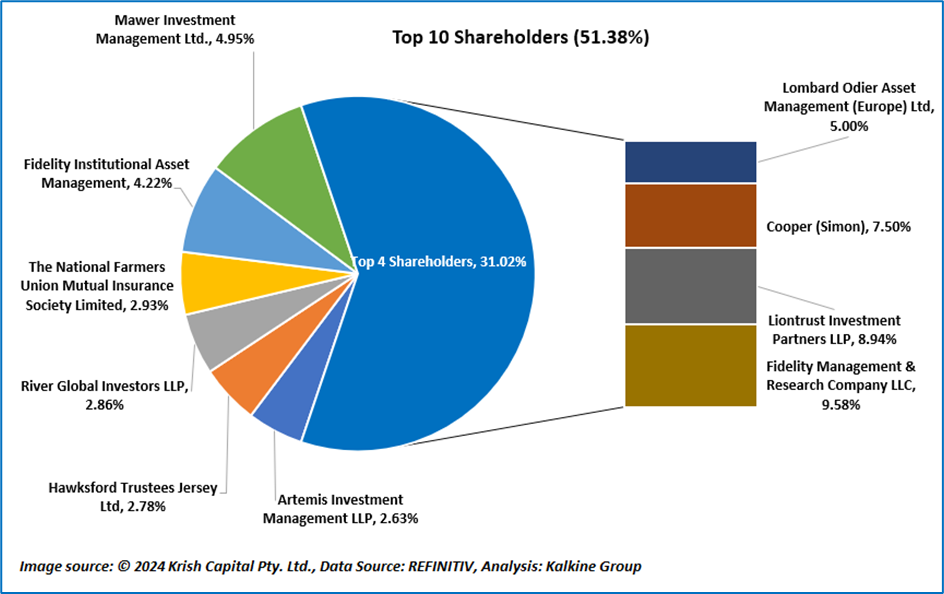
Top 10 shareholders
The top ten shareholders of OTB together own approximately 51.38% of all shares. Fidelity Management & Research Company LLC holds the largest stake, about 9.58%. Following closely is Liontrust Investment Partners LLP, owning around 8.94%, as illustrated in the chart below:
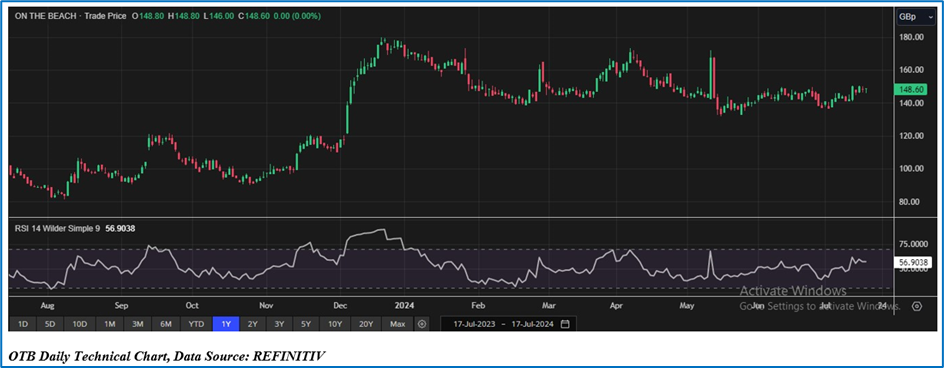
Stock performance
Over the last three months, OTB's stock price has fallen by roughly 1.99%, and over the past six months, it has experienced a decline of about 7.28%. The stock’s 52-week low and 52-week high spans from GBX 81.24 & GBX 181.60, respectively. It is currently trading higher than the average of its 52-week high-low.
Note 1: Past performance is not a reliable indicator of future performance.
Note 2: The reference data for all price data, currency, technical indicators, support, and resistance levels is 17 July 2024. The reference data in this report has been partly sourced from EODHD/Others.
