


Highlights
- For the full fiscal year 2023, FDM’s Global Consultant utilisation rate stood at 92.8%.
- In FY23, the group witnessed around 1% year-on-year rise in its top-line business.
- FDM’s working capital management improved in FY23 with 111.8% growth in cash conversion.
FDM Group (Holdings) PLC, a British multinational professional services company listed on the FTSE All-Share (LSE:FDM), offers a range of services including recruitment, business consulting, training, and IT solutions. With a global workforce of over 5,000 people from more than 90 countries, FDM has grown from its UK roots to encompass 18 offices across Europe, North America, and Asia-Pacific. It has emerged as a key player in the tech and innovation space for over 30 years.
For the full fiscal year 2023, the Global Consultant utilisation rate stood at 92.8%.
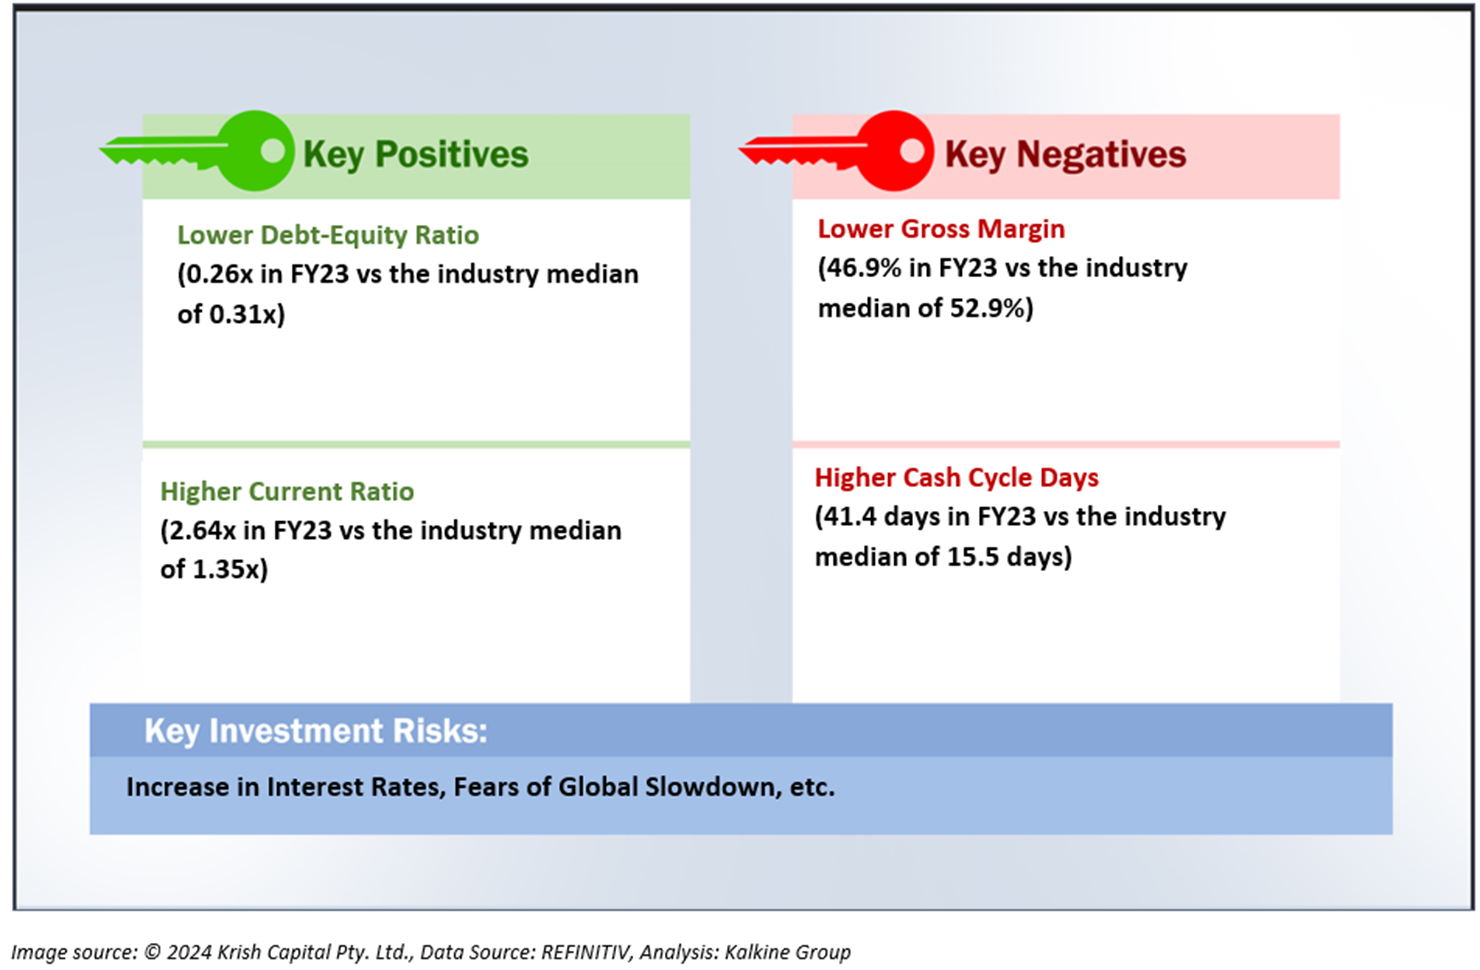
In FY23, the group witnessed approximately 1% year-on-year (YoY) growth in top-line business. Its profit before tax grew ~21.2% in the reporting period. Its working capital management saw impressive improvement in FY23 with 111.8% growth in cash conversion in FY23. Cash cobversion rate was approximately 108.3% in FY22. Also, FDM witnesses approximately 23.7% growth in its cash generation from operations in FY23 versus FY22.
FDM Group has announced to pay a final dividend of 19 pence per share for FY23.
In February 2024, FDM selected Michelle Senecal de Fonseca, a Non-Executive Director within the Group, to join the board of Redcentric PLC as a non-executive director, also appointing her as the chair of its remuneration committee.
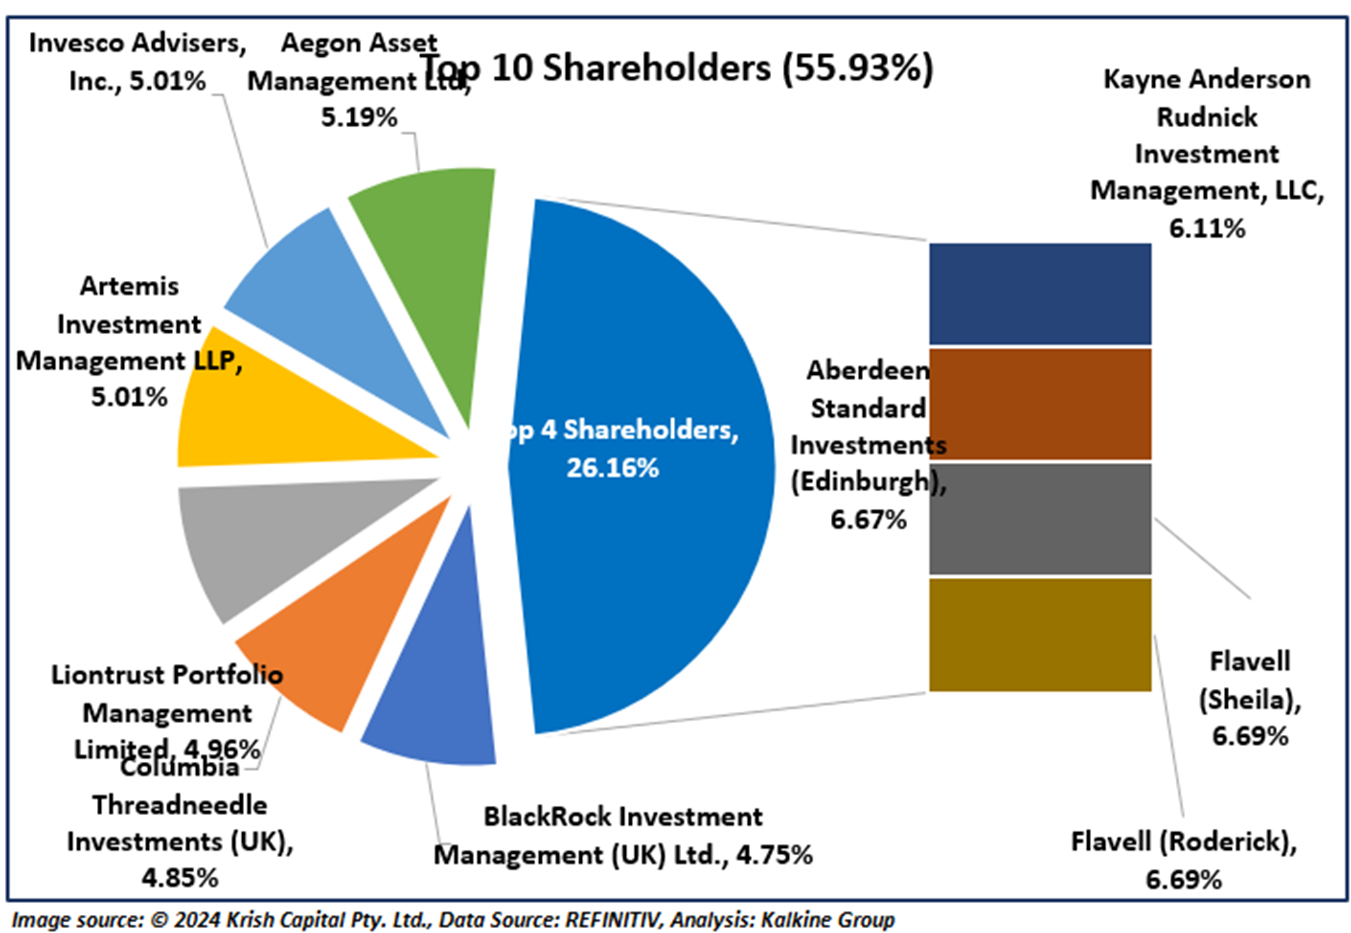
Top 10 Shareholders:
Around 55.93% of the total shareholdings is held by its top ten shareholders. While Flavell (Roderick) is the biggest shareholder in FDM with ~6.69% shareholding, Flavell (Sheila) is the second biggest shareholder with 6.69% shareholding.
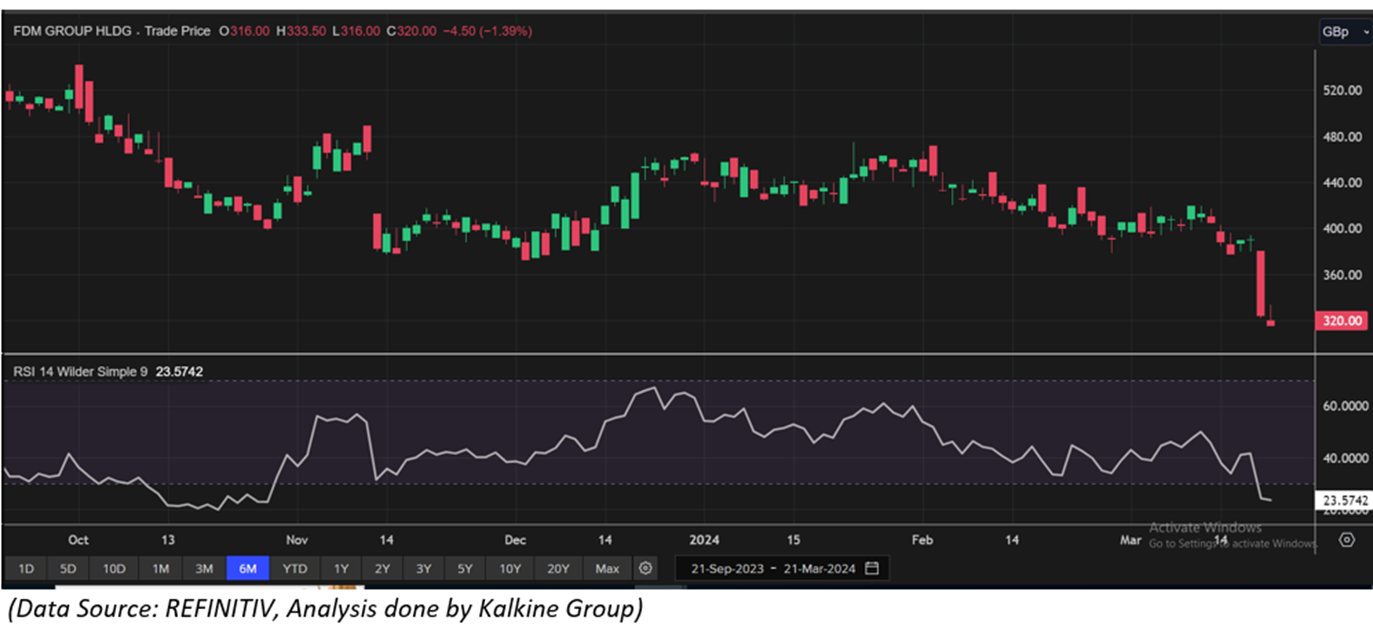
Stock Price Performance
FDM’s stock price has fallen 21.53% in the last one month. It has declined by ~35.81% over the last six months. The stock’s 52-week low and high price stand at GBX 313.75 and GBX 800.00, respectively.
Note 1: Past performance is not a reliable indicator of future performance.
Note 2: The reference data for all price data, currency, technical indicators, support, and resistance levels is 21 March 2024. The reference data in this report has been partly sourced from EODHD/Others.
