
_08_07_2025_09_02_40_546518.png)
_06_16_2026_04_54_27_535266.jpg)


Highlights
- WGX revenue rose 72% YoY to AUD 624 million in 1HFY25, ending FY25 with AUD 364 million in liquid assets.
- Full-year FY25 gold production reached a record 326,384 ounces, though slightly below guidance, with all-in sustaining costs of AUD 2,666 per ounce.
- Cash, bullion, and liquid investments rose to AUD 364 million at the end of Q4FY25.
Westgold Resources Limited (ASX:WGX) is a West Australian gold miner that operates integrated underground and open pit mines, processing hubs, and exploration assets across the Murchison and Southern Goldfields.
In the first half of the financial year 2025 (1HFY25), WGX reported revenue of AUD 624.0 million, up 72% YoY from AUD 362.0 million in 1HFY24, supported by an improvement in gold prices and higher production. The achieved gold price rose to AUD 2,562 per ounce, up 22% from AUD 2,093 per ounce in the prior period. Despite the revenue increase, EBITDA declined by 4% to AUD 140.0 million, compared to AUD 146.0 million in 1HFY24.
During the reported period, gold production increased by 29.4% YoY to 158,255 ounces compared to the prior corresponding period, driven by the acquisition of Karora and five-month production contribution from the southern goldfields.
In the fourth quarter of the financial year 2025 (Q4FY25), WGX recorded group gold production of 88,022 ounces at an all-in sustaining cost (AISC) of AUD 2,688 per ounce. For the full year FY25, total gold production reached a record 326,384 ounces at an AISC of AUD 2,666 per ounce, slightly below the company’s guidance range of 330,000–350,000 ounces at AUD 2,400–2,600 per ounce. During the quarter, group mine productivity and milling output improved across all operations on a quarterly basis. Gold sales during the quarter amounted to 71,500 ounces at an average realised price of AUD 5,174 per ounce, generating revenue of AUD 370 million. Meanwhile, closing cash, bullion, and liquid investments rose by AUD 132 million quarter-on-quarter to reach AUD 364 million.
Business Update
In FY25, WGX concluded several growth investments, including infrastructure upgrades at Beta Hunt, expansion at Bluebird-South Junction, expanded drilling at Fletcher and development of the Great Fingall. The Karora merger significantly expanded its asset base and production capacity, reinforcing its position among Australia's mid-tier gold producers.
Company Outlook
WGX is set to release comprehensive FY26 production and cost guidance in August 2025, followed by a 3-year business outlook in September. A steady production ramp-up is forecasted at Bluebird-South Junction along with first stope mining at Great Fingall. Higher output is expected from Beta Hunt, Starlight, and Big Bell.
The company’s management anticipates a decline in AISC in FY26, driven by increased production from key assets, reduced reliance on smaller high-cost mines, and ongoing cost optimisation.
The company views FY25 as a transformational year and expects infrastructure investments and key mine expansions to drive cash flow in FY26.
Share performance of WGX
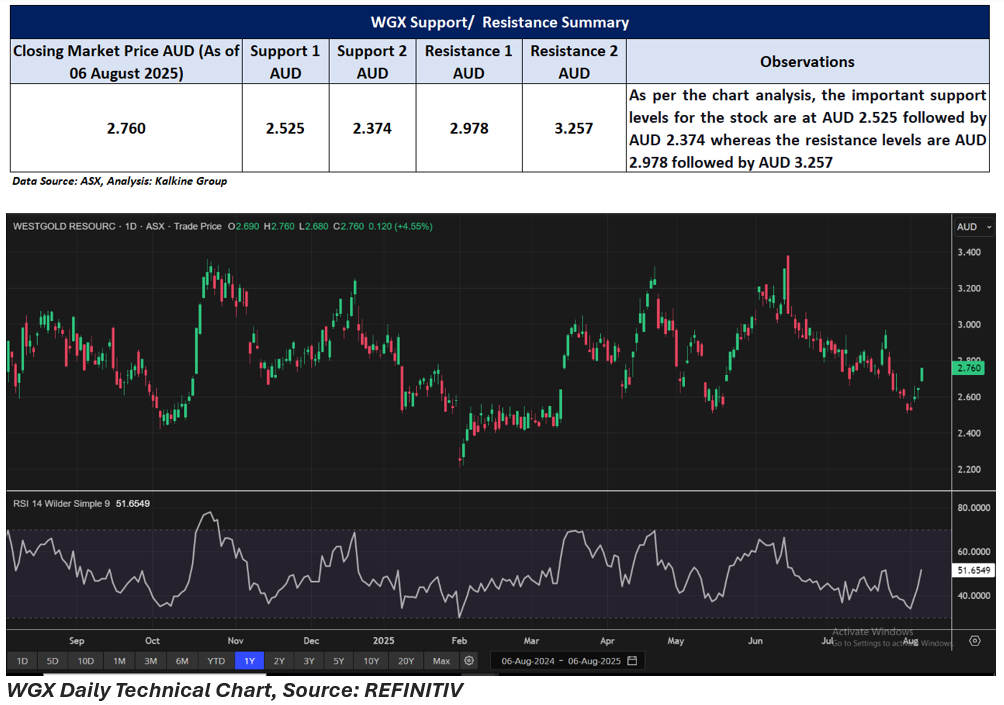
WGX shares closed at AUD 2.760 on 6 August 2025, marking a 4.55% intraday gain. Despite this uptick, WGX stock price has declined 5.15% over the past year and is down 2.47% year-to-date. However, the stock is up 0.73% over the past month and 14.05% over the past six months.
The 52-week high for WGX stands at AUD 3.380, reached on 16 June 2025, while the 52-week low is AUD 2.210, recorded on 3 February 2025.
Support and Resistance Summary
Note 1: Past performance is neither an Indicator nor a guarantee of future performance.
Note 2: The reference date for all price data, and currency, is 06 August 2025. The reference data in this report has been partly sourced from EODHD/Others.
Technical Indicators Defined:
Support: A level at which the stock prices tend to find support if they are falling, and a downtrend may take a pause backed by demand or buying interest. Support 1 refers to the nearby support level for the stock and if the price breaches the level, then Support 2 may act as the crucial support level for the stock.
Resistance: A level at which the stock prices tend to find resistance when they are rising, and an uptrend may take a pause due to profit booking or selling interest. Resistance 1 refers to the nearby resistance level for the stock and if the price surpasses the level, then Resistance 2 may act as the crucial resistance level for the stock.
Disclaimer
This article has been prepared by Kalkine Media, echoed on the website kalkinemedia.com/au and associated pages, based on the information obtained and collated from the subscription reports prepared by Kalkine Pty. Ltd. [ABN 34 154 808 312; AFSL no. 425376] on Kalkine.com.au (and associated pages). The principal purpose of the content is to provide factual information only for educational purposes. None of the content in this article, including any news, quotes, information, data, text, reports, ratings, opinions, images, photos, graphics, graphs, charts, animations, and video is or is intended to be, advisory in nature. The content does not contain or imply any recommendation or opinion intended to influence your financial decisions, including but not limited to, in respect of any particular security, transaction, or investment strategy, and must not be relied upon by you as such. The content is provided without any express or implied warranties of any kind. Kalkine Media, and its related bodies corporate, agents, and employees (Kalkine Group) cannot and do not warrant the accuracy, completeness, timeliness, merchantability, or fitness for a particular purpose of the content or the website, and to the extent permitted by law, Kalkine Group hereby disclaims any and all such express or implied warranties. Kalkine Group shall NOT be held liable for any investment or trading losses you may incur by using the information shared on our website.
