


Highlights
- Regal Partners is an Australia based firm which offers investment management services
- Recently, RPL entered into an agreement to acquire 50% issued capital of financial solutions provider, Taurus SM Holdings Pty
- In the past one month, RPL’s share price has surged by over 22%
Regal Partners Limited (ASX:RPL) is an ASX-listed financial services company that offers investment management services. The company manages a diverse range of investment strategies including private markets, hedge funds, capital solutions and real and natural assets on behalf of private investors, charitable groups, family offices and institutions.
Yesterday (15 November 2023), RPL’s shares outperformed the sectoral benchmark index, S&P/ASX 200 Financials (INDEXASX: XFJ) by recording a rise of 8.74%, while the XFJ surged by 0.48%. Noteworthy here is that, yesterday, RPL shares recorded the highest rise in the past one year. In the last one month, RPL shares have rallied over 22%.
The share price jump has been triggered by multiple price sensitive announcements by the company over the last couple of weeks.
On 1 November, RPL made an announcement concerning the agreement with Taurus SM Holdings Pty Limited to acquire 50% shares in Taurus. Established in 2006, Taurus is specialized in providing financial solutions to international junior mining and mid-tier firms. This transaction would take RPL’s FUM to AUD 8.0 billion on a pro forma basis, informed RPL.
Similarly, on 3 November 2023, RPL informed about the acquisition of PM Capital Limited, an investment management company with a core focus on global long/short equities and fixed income strategies.
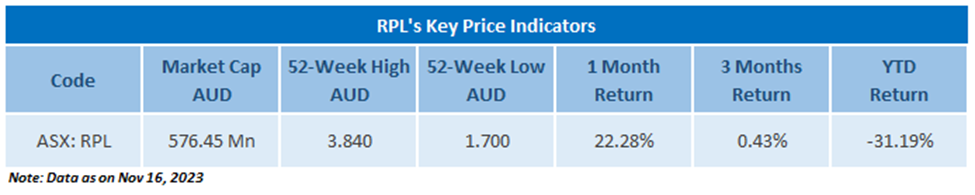
Here’s the key price indicators of RPL.
Technical Observation
Following the recent rally in RPL shares, the stock broke a falling trend line by the upside and are sustaining above the breakout level, indicating the possibility of further upside direction hereon. The trend line breakout in the stock is backed by increased volumes, which further supports possibility of a positive momentum.
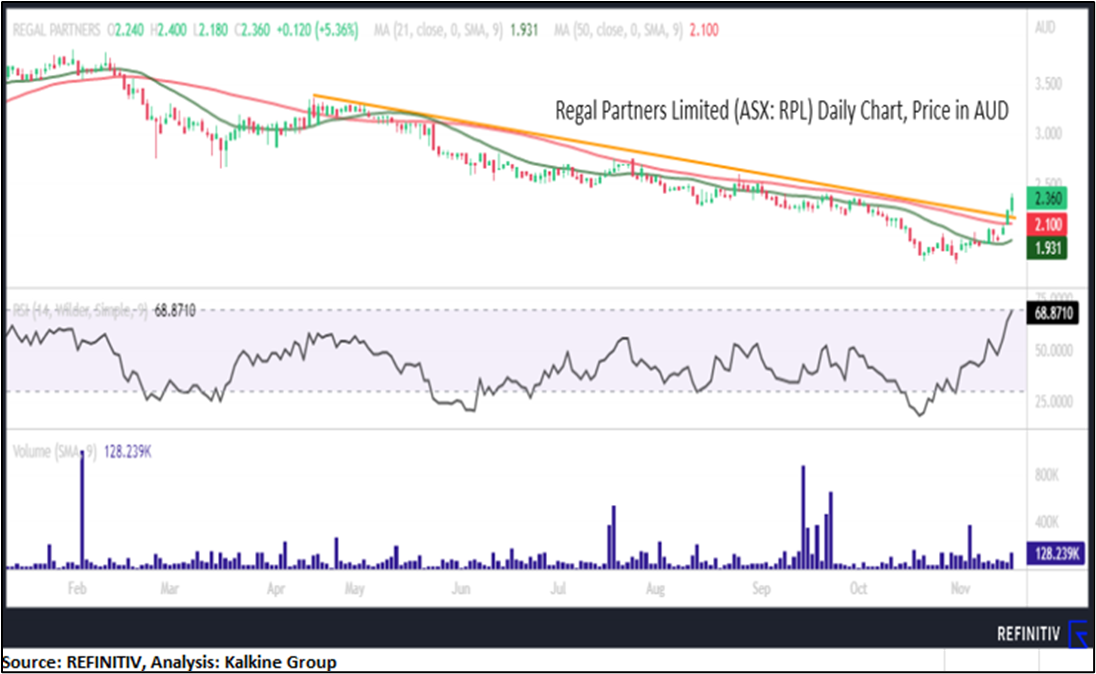
As seen from the above price chart, the leading indicator RSI (14-period) is above the midpoint on the daily and weekly chart, indicating an upside momentum in the stock. The CMP is above the trend following indicators 21-period SMA, 50-period SMA, and Parabolic SAR, further supporting a positive bias. The MACD histogram is also moving in the positive territory.
The reference date for all price data, currency, technical indicators, support, and resistance levels is November 16, 2023. The reference data in this report has been partly sourced from EODHD/Others.
Note 1: Past performance is neither an Indicator nor a guarantee of future performance.
Technical Indicators Defined:
The Green colour line reflects the 21-period moving average. SMA helps to identify existing price trends. If the prices are trading above the 21-period, prices are currently in a bullish trend (Vice – Versa).
The Blue colour line reflects the 50-period moving average. SMA helps to identify existing price trends. If the prices are trading above the 50-period, prices are currently in a bullish trend (Vice – Versa).
The Orange/ Yellow colour line represents the Trendline.
The Purple colour line in the chart’s lower segment reflects the Relative Strength Index (14-Period), which indicates price momentum and signals momentum in trend. A reading of 70 or above suggests overbought status, while a reading of 30 or below suggests an oversold status.
Disclaimer
This article has been prepared by Kalkine Media, echoed on the website kalkinemedia.com/au and associated pages, based on the information obtained and collated from the subscription reports prepared by Kalkine Pty. Ltd. [ABN 34 154 808 312; AFSL no. 425376] on Kalkine.com.au (and associated pages). The principal purpose of the content is to provide factual information only for educational purposes. None of the content in this article, including any news, quotes, information, data, text, reports, ratings, opinions, images, photos, graphics, graphs, charts, animations, and video is or is intended to be, advisory in nature. The content does not contain or imply any recommendation or opinion intended to influence your financial decisions, including but not limited to, in respect of any particular security, transaction, or investment strategy, and must not be relied upon by you as such. The content is provided without any express or implied warranties of any kind. Kalkine Media, and its related bodies corporate, agents, and employees (Kalkine Group) cannot and do not warrant the accuracy, completeness, timeliness, merchantability, or fitness for a particular purpose of the content or the website, and to the extent permitted by law, Kalkine Group hereby disclaims any and all such express or implied warranties. Kalkine Group shall NOT be held liable for any investment or trading losses you may incur by using the information shared on our website.
