
_12_16_2025_12_41_01_699678.png)


Highlights
- FY25 revenue of PRU rose 22% YoY to USD 1,248.1 million in FY25 and EBITDA increased 18% YoY to USD 740.3 million.
- Operating cash flow surged 25% YoY to USD 536.7 million in FY25.
- FY25 gold production reached 99,953 ounces at an AISC of USD 1,463/oz.
- FY26 gold production forecast stands at 400,000–440,000 ounces.
Perseus Mining Limited (ASX:PRU), a gold-focused company operating multiple mines in Africa, reported encouraging full-year results for the financial year 2025 (FY25), reflecting the benefits of higher gold prices and disciplined operational management. Revenue for the year increased 22% YoY to USD 1,248.1 million, while EBITDA rose 18% YoY to USD 740.3 million. In FY25, operating cash flow climbed 25% YoY to USD 536.7 million and profit after tax jumped 16% YoY.
FY25 performance was driven primarily by a 26% increase in realised gold prices, which offset slightly lower production volumes. The company’s results were achieved despite rising costs, higher royalties, elevated taxes, and one-off restructuring expenses.
Production and Operational Highlights
During September 2025 quarter, the company produced 99,953 ounces of gold at an AISC of USD 1,463 per ounce, generating USD 161 million in notional operating cash flow. The company’s cash and bullion holdings rose to USD 837 million, complemented by USD 134 million in liquid securities. Development continued at the CMA Underground and Nyanzaga projects, with first production expected in March 2027.
In addition, the company renewed its AUD 100 million share buyback program.
Strategic Update on Predictive Acquisition
On 16 December 2025, the company announced the termination of its binding acquisition proposal for Predictive Discovery. The decision followed a revised merger agreement between Predictive and Robex Resources. While Perseus considered its original offer superior, it will not submit a new proposal unless circumstances change.
Outlook for FY26 and Beyond
Perseus expects FY26 gold production of 400,000–440,000 ounces at an AISC of USD 1,460–1,620 per ounce, underpinned by steady output from Yaouré, Edikan, and Sissingué. Development at CMA Underground is progressing, with multiple portals planned in Q2 FY26, while Nyanzaga is on track for first production in March 2027. Both projects are expected to extend mine life, improve production flexibility, and contribute to long-term cash flow growth.
Share Performance of PRU
PRU shares edged lower by 0.19% to close at AUD 5.39 per share on 16 December 2025. Despite the slight daily decline, the stock has delivered positive gains over longer periods, rising 101.87% over the past year. PRU’s share price has advanced 109.73% year-to-date and is up 10.00% quarter-to-date. Over the past six and nine months, the stock has climbed 41.10% and 70.57%, respectively, while it gained 26.53% over the last three months.
The stock’s 52-week high stands at AUD 5.79, reached on 1 December 2025, while the 52-week low is AUD 2.51, recorded on 27 December 2024.
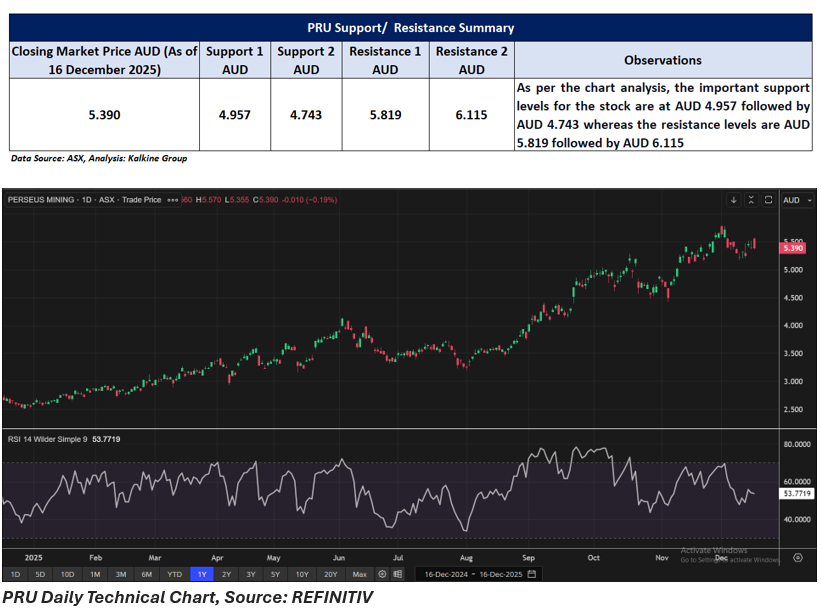
Support and Resistance Summary
Note 1: Past performance is neither an Indicator nor a guarantee of future performance.
Note 2: The reference date for all price data, and currency, is 16 December 2025. The reference data in this report has been partly sourced from EODHD/Others.
Technical Indicators Defined:
Support: A level at which the stock prices tend to find support if they are falling, and a downtrend may take a pause backed by demand or buying interest. Support 1 refers to the nearby support level for the stock and if the price breaches the level, then Support 2 may act as the crucial support level for the stock.
Resistance: A level at which the stock prices tend to find resistance when they are rising, and an uptrend may take a pause due to profit booking or selling interest. Resistance 1 refers to the nearby resistance level for the stock and if the price surpasses the level, then Resistance 2 may act as the crucial resistance level for the stock.
Disclaimer
This article has been prepared by Kalkine Media, echoed on the website kalkinemedia.com/au and associated pages, based on the information obtained and collated from the subscription reports prepared by Kalkine Pty. Ltd. [ABN 34 154 808 312; AFSL no. 425376] on Kalkine.com.au (and associated pages). The principal purpose of the content is to provide factual information only for educational purposes. None of the content in this article, including any news, quotes, information, data, text, reports, ratings, opinions, images, photos, graphics, graphs, charts, animations, and video is or is intended to be, advisory in nature. The content does not contain or imply any recommendation or opinion intended to influence your financial decisions, including but not limited to, in respect of any particular security, transaction, or investment strategy, and must not be relied upon by you as such. The content is provided without any express or implied warranties of any kind. Kalkine Media, and its related bodies corporate, agents, and employees (Kalkine Group) cannot and do not warrant the accuracy, completeness, timeliness, merchantability, or fitness for a particular purpose of the content or the website, and to the extent permitted by law, Kalkine Group hereby disclaims any and all such express or implied warranties. Kalkine Group shall NOT be held liable for any investment or trading losses you may incur by using the information shared on our website.
