
_08_08_2025_10_10_45_627932.png)


Highlights
- In H1FY25, PR reported revenue of USD 581.8 million, up 19% YoY.
- The company expects gold production of 470–505koz in FY25.
- PRU continues development of Nyanzaga, targeting first gold in January 2027.
Perseus Mining Limited (ASX:PRU) is an ASX-listed gold-focused company engaged in discovering, acquiring, developing, and operating multiple gold mines and conducting mineral exploration across West Africa.
In the first half of the financial year 2025 (H1FY25), PRU reported revenue of USD 581.79 million, up 18.98% YoY from USD 488.96 million in H1FY24, supported by higher realised gold prices and strong production at Yaouré and Edikan. Net profit for the period increased by 25.73% YoY to USD 178.29 million, compared to USD 145.50 million a year earlier. Operating cash flow increased 22.53% YoY to USD 247.56 million in H1FY25, as compared to USD 211.21 million in H1FY24.
In the June 2025 quarter, PRU produced 121,237 ounces of gold at an AISC of USD 1,417 per ounce, while growing its cash and bullion balance to USD 827 million. The company sold 131,242 ounces of gold at a weighted average price of USD 2,977 per ounce. Development of the Nyanzaga project remained on schedule, supported by encouraging drilling results and a debt-free position.
Business Update
PRU has repurchased 344,816 shares as of 6 August 2025, totalling 23.6 million shares so far, with a maximum of 40 million shares allowed for repurchase.
Jeff Quartermaine will retire as MD and CEO on 30 September 2025, to be succeeded by Craig Jones on 1 October 2025.
Company Outlook
For FY25, PRU expects gold production of 470,000–505,000 oz, and expects 400,000–440,000 oz of gold production in FY26 with AISC at USD 1,460–1,620/oz, before stabilising at 515,000–535,000 oz annually through FY30 across four African mines. PRU forecasts long-term AISC at USD 1,400–1,500/oz with minimal year-on-year variation.
For the five-year outlook period, PRU has allocated USD 878 million in development capital for growth projects, including the Nyanzaga Project, which targets first gold production in January 2027. The project expects >USD 500/oz margins, with 93% of production backed by Ore Reserves and further infill drilling underway in FY26.
Share performance of PRU
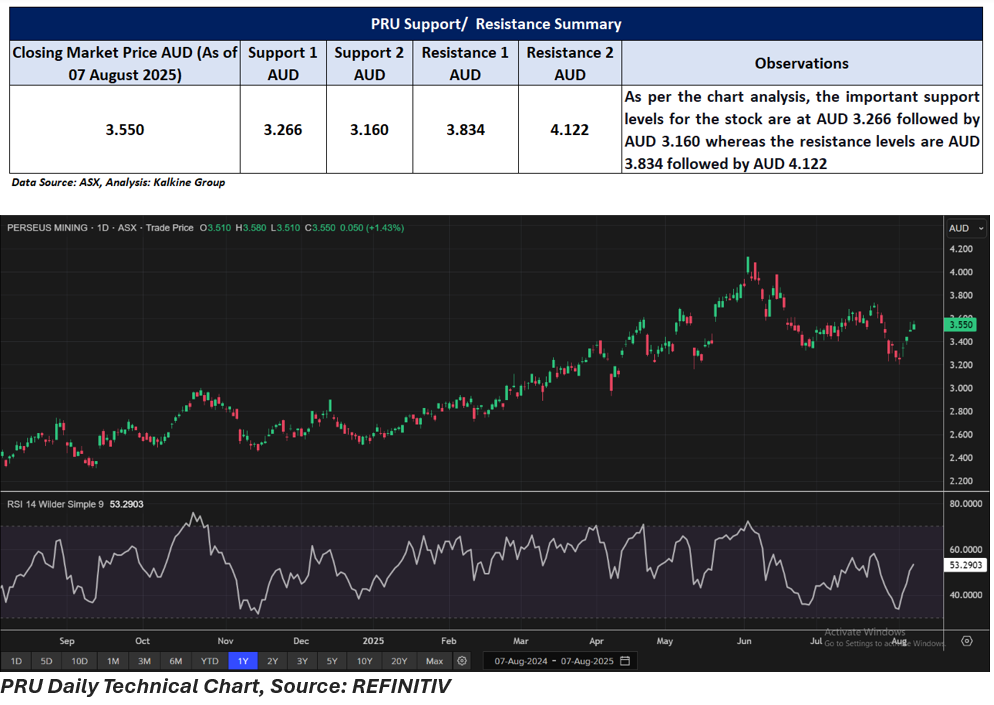
PRU shares rose by 1.43% to close at AUD 3.550 per share on 7 August 2025. Over the past year, PRU’s stock price has gained 44.90% and is up 38.13% year-to-date. It has returned 39.22% over the past nine months and 21.58% over six months, though it dipped 2.20% across the past three months. The 52-week high for PRU is AUD 4.130, reached on 3 June 2025, while the 52-week low is AUD 2.310, recorded on 12 September 2024.
Support and Resistance Summary
Note 1: Past performance is neither an Indicator nor a guarantee of future performance.
Note 2: The reference date for all price data, and currency, is 07 August 2025. The reference data in this report has been partly sourced from EODHD/Others.
Technical Indicators Defined:
Support: A level at which the stock prices tend to find support if they are falling, and a downtrend may take a pause backed by demand or buying interest. Support 1 refers to the nearby support level for the stock and if the price breaches the level, then Support 2 may act as the crucial support level for the stock.
Resistance: A level at which the stock prices tend to find resistance when they are rising, and an uptrend may take a pause due to profit booking or selling interest. Resistance 1 refers to the nearby resistance level for the stock and if the price surpasses the level, then Resistance 2 may act as the crucial resistance level for the stock.
Disclaimer
This article has been prepared by Kalkine Media, echoed on the website kalkinemedia.com/au and associated pages, based on the information obtained and collated from the subscription reports prepared by Kalkine Pty. Ltd. [ABN 34 154 808 312; AFSL no. 425376] on Kalkine.com.au (and associated pages). The principal purpose of the content is to provide factual information only for educational purposes. None of the content in this article, including any news, quotes, information, data, text, reports, ratings, opinions, images, photos, graphics, graphs, charts, animations, and video is or is intended to be, advisory in nature. The content does not contain or imply any recommendation or opinion intended to influence your financial decisions, including but not limited to, in respect of any particular security, transaction, or investment strategy, and must not be relied upon by you as such. The content is provided without any express or implied warranties of any kind. Kalkine Media, and its related bodies corporate, agents, and employees (Kalkine Group) cannot and do not warrant the accuracy, completeness, timeliness, merchantability, or fitness for a particular purpose of the content or the website, and to the extent permitted by law, Kalkine Group hereby disclaims any and all such express or implied warranties. Kalkine Group shall NOT be held liable for any investment or trading losses you may incur by using the information shared on our website.
