


Highlights
- In February 2025, the company secured AUD 75M haulage contract with Westgold Resources.
- MLG’s revenue surged 20.31% YoY to AUD 268.56M in H1 FY25, and gross profit rose 11.95% YoY to AUD 40.79 million.
- The company focuses on strategic investments in fleet expansion and cost-cutting initiatives.
MLG Oz Limited (ASX:MLG), a mining services and resource asset management company based in Kalgoorlie, has secured a significant AUD 75 million haulage contract with Westgold Resources. The three-year bulk haulage agreement, commencing in March 2025, is expected to generate over AUD 25 million annually. This contract includes ore haulage, stockpile management, and haul road maintenance for Westgold’s Southern Goldfields operations.
Financial Performance in H1 FY25
For the first half of the financial year 2025 (H1 FY25), MLG Oz reported revenue growth despite certain profitability challenges:
- Revenue increased by 20.31% YoY to AUD 268.56 million from AUD 223.22 million.
- Gross profit improved by 11.95% YoY, reaching AUD 40.79 million compared to AUD 36.43 million.
- EBITDA rose by 2.69% YoY, amounting to AUD 29.29 million from AUD 28.53 million.
Despite revenue gains, net profit after tax (NPAT) declined due to higher depreciation costs linked to recent fleet investments and reduced revenue in the crushing and screening segment. However, mine site services and bulk haulage revenues saw a 32.7% YoY increase to AUD 246.7 million, driven by expanding client contracts and increased service demand.
During the reported period, MLG made strategic investments, including AUD 29.2 million in fleet expansion and an AUD 3.5 million accommodation facility in Kalgoorlie to reduce rental costs.
Outlook
MLG Oz is optimistic about the H2 FY25, expecting sustained revenue and profit growth driven by recent contract wins and fleet optimisation. The company expects to benefit from strength in gold prices is expected to support mining activity and demand for ore haulage services.
Furthermore, the company is exploring opportunities in open-pit mining and project funding to enhance its long-term earnings potential. MLG is also focused on cost management initiatives, including investments in fleet efficiency and Kalgoorlie accommodation facilities with the aim to streamline operations and improve margins.
Share performance of MLG
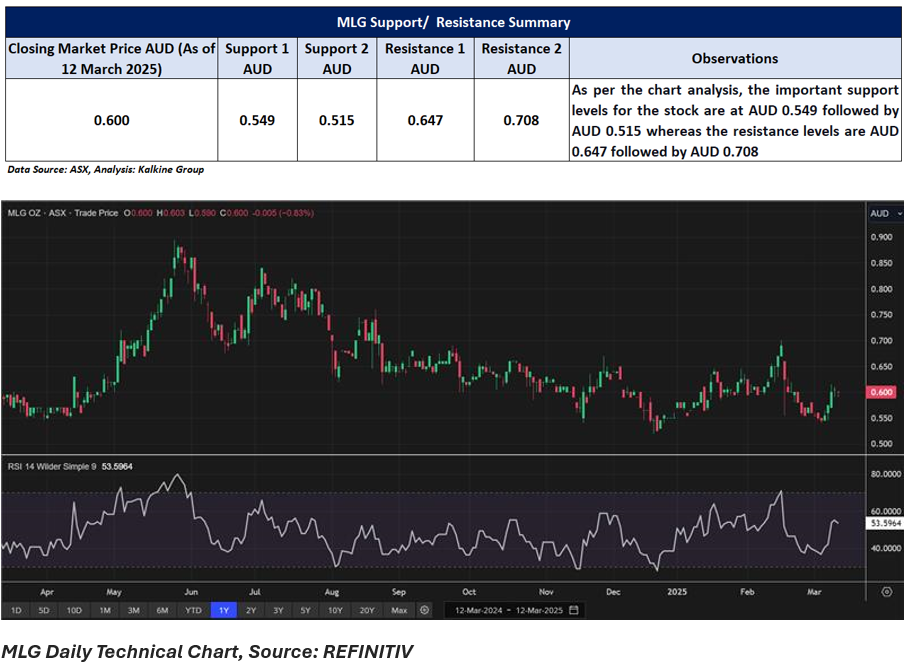
MLG shares closed 0.83% lower at AUD 0.60 per share on 12 March 2025. In a week, MLG’s share price has increased by 10.09%, and in last nine months, it has dropped by nearly 17.24%.
52-week high of MLG is AUD 0.895, recorded on 27 May 2024 and 52-week low is AUD 0.52, recorded on 18 December 2024.
Support and Resistance Summary
Note 1: Past performance is neither an Indicator nor a guarantee of future performance.
Note 2: The reference date for all price data, and currency, is 12 March 2025. The reference data in this report has been partly sourced from EODHD/Others.
Technical Indicators Defined:
Support: A level at which the stock prices tend to find support if they are falling, and a downtrend may take a pause backed by demand or buying interest. Support 1 refers to the nearby support level for the stock and if the price breaches the level, then Support 2 may act as the crucial support level for the stock.
Resistance: A level at which the stock prices tend to find resistance when they are rising, and an uptrend may take a pause due to profit booking or selling interest. Resistance 1 refers to the nearby resistance level for the stock and if the price surpasses the level, then Resistance 2 may act as the crucial resistance level for the stock.
Disclaimer
This article has been prepared by Kalkine Media, echoed on the website kalkinemedia.com/au and associated pages, based on the information obtained and collated from the subscription reports prepared by Kalkine Pty. Ltd. [ABN 34 154 808 312; AFSL no. 425376] on Kalkine.com.au (and associated pages). The principal purpose of the content is to provide factual information only for educational purposes. None of the content in this article, including any news, quotes, information, data, text, reports, ratings, opinions, images, photos, graphics, graphs, charts, animations, and video is or is intended to be, advisory in nature. The content does not contain or imply any recommendation or opinion intended to influence your financial decisions, including but not limited to, in respect of any particular security, transaction, or investment strategy, and must not be relied upon by you as such. The content is provided without any express or implied warranties of any kind. Kalkine Media, and its related bodies corporate, agents, and employees (Kalkine Group) cannot and do not warrant the accuracy, completeness, timeliness, merchantability, or fitness for a particular purpose of the content or the website, and to the extent permitted by law, Kalkine Group hereby disclaims any and all such express or implied warranties. Kalkine Group shall NOT be held liable for any investment or trading losses you may incur by using the information shared on our website.
