


Highlights
- MAH reported 22% YoY revenue growth in H1FY25 to AUD 1.2 billion.
- The company enters FY5 with AUD 4.3 billion in order book and AUD 24.8 billion in tender pipeline.
- MAH reaffirmed FY25 revenue guidance of AUD 2.4–2.5 billion and EBIT of AUD 160–175 million.
Macmahon Holdings Limited (ASX:MAH) is a Perth-based Australian mining and civil construction company, providing end-to-end infrastructure and mining services including surface and underground mining, drilling and blasting, mine planning, load and haul, crushing and screening, and maintenance of equipment.
In the first half of the financial year 2025 (H1FY25), the company’s revenue rose by 22% YoY to AUD 1.2 billion, mainly due to the acquisition of Decmil in August 2024 and organic growth in existing mining projects such as the Greenbushes Lithium Mine, Daisy Milano Gold Mine, and Ulysses Gold Mine in Western Australia. Underlying EBIT increased by 14.71% YoY to AUD 78.00 million, while underlying PBT surged by 10.91% YoY to AUD 61.00 million during the period. The dividend per share grew by 22.22% YoY to 0.55 cents compared to 0.45 cents in H1FY24.
Business Update
In April 2025, MAH secured AUD 172 million in underground mining contracts across key gold projects in Western Australia, while in May 2025, its subsidiary Decmil was awarded AUD 80 million in civil infrastructure contracts for energy and accommodation projects in Queensland, contributing over AUD 400 million to the Decmil’s new work for FY25.
In June 2025, MAH secured a new four-year AUD 550 million syndicated debt facility, replacing its previous AUD 330 million facility and Decmil’s legacy AUD 40 million facilities, with the aim of simplifying the company’s capital structure and providing improved pricing, covenants, and terms. Additionally, 11,484,998 shares held in escrow from the Decmil acquisition will be released and tradable on the ASX from 1 July 2025.
Company Outlook
MAH reaffirmed its FY25 revenue guidance of AUD 2.4–2.5 billion with AUD 2.2 billion secured in contracts and expects underlying EBIT between AUD 160 million and AUD 175 million. The company forecast is backed by AUD 4.3 billion order book, AUD 800 million in new work, and AUD 24.8 billion tender pipeline, giving revenue visibility for FY25 and beyond.
Bottom of Form
Share performance of MAH
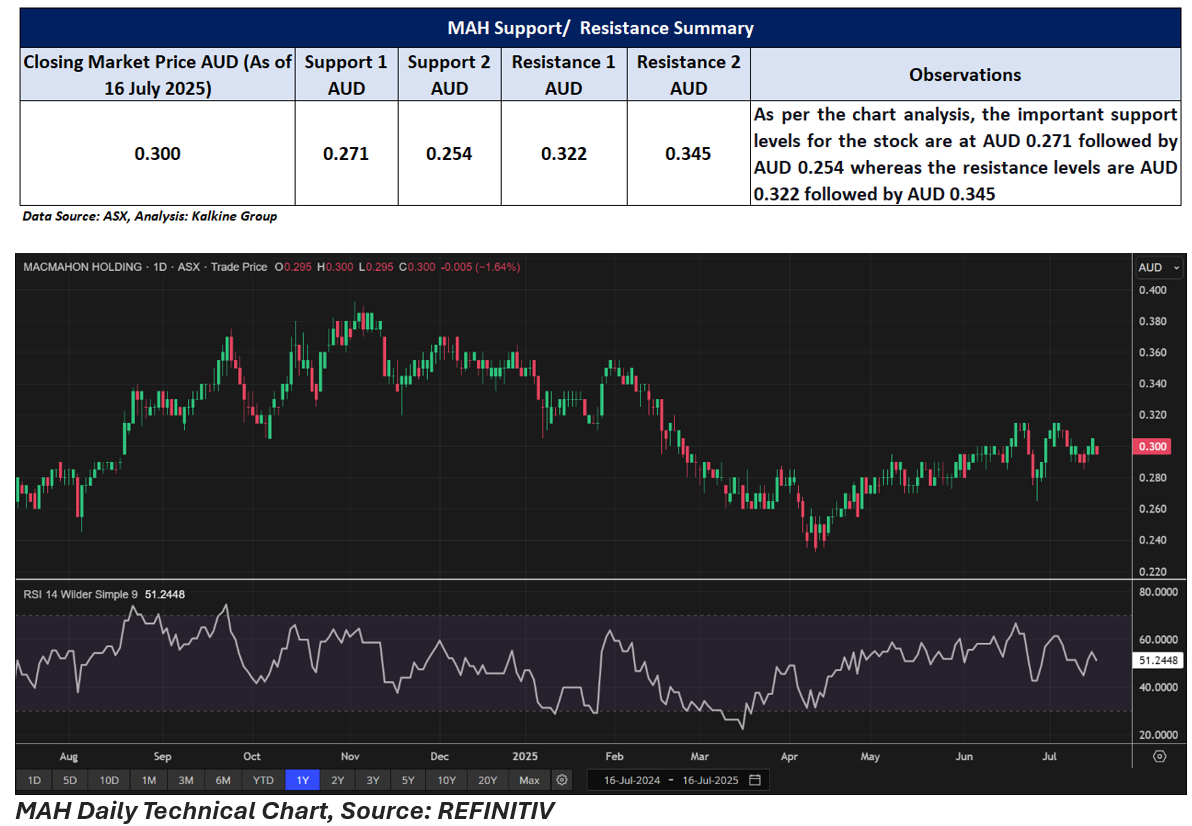
MAH shares closed 1.64% lower at AUD 0.300 per share on 16 July 2025. Over the past year, the stock has gained 7.14%, and it has risen 3.45% over the past month and 15.38% in the past three months. However, the stock is down 9.09% over the last six months.
The 52-week high for MAH is AUD 0.393, recorded on 4 November 2024, while the 52-week low is AUD 0.233, recorded on 9 April 2025.
Support and Resistance Summary
Note 1: Past performance is neither an Indicator nor a guarantee of future performance.
Note 2: The reference date for all price data, and currency, is 16 July 2025. The reference data in this report has been partly sourced from EODHD/Others.
Technical Indicators Defined:
Support: A level at which the stock prices tend to find support if they are falling, and a downtrend may take a pause backed by demand or buying interest. Support 1 refers to the nearby support level for the stock and if the price breaches the level, then Support 2 may act as the crucial support level for the stock.
Resistance: A level at which the stock prices tend to find resistance when they are rising, and an uptrend may take a pause due to profit booking or selling interest. Resistance 1 refers to the nearby resistance level for the stock and if the price surpasses the level, then Resistance 2 may act as the crucial resistance level for the stock.
Disclaimer
This article has been prepared by Kalkine Media, echoed on the website kalkinemedia.com/au and associated pages, based on the information obtained and collated from the subscription reports prepared by Kalkine Pty. Ltd. [ABN 34 154 808 312; AFSL no. 425376] on Kalkine.com.au (and associated pages). The principal purpose of the content is to provide factual information only for educational purposes. None of the content in this article, including any news, quotes, information, data, text, reports, ratings, opinions, images, photos, graphics, graphs, charts, animations, and video is or is intended to be, advisory in nature. The content does not contain or imply any recommendation or opinion intended to influence your financial decisions, including but not limited to, in respect of any particular security, transaction, or investment strategy, and must not be relied upon by you as such. The content is provided without any express or implied warranties of any kind. Kalkine Media, and its related bodies corporate, agents, and employees (Kalkine Group) cannot and do not warrant the accuracy, completeness, timeliness, merchantability, or fitness for a particular purpose of the content or the website, and to the extent permitted by law, Kalkine Group hereby disclaims any and all such express or implied warranties. Kalkine Group shall NOT be held liable for any investment or trading losses you may incur by using the information shared on our website.
