


Highlights
- GQG Partners reported a 46.91% YoY increase in net revenue, reaching USD 760.4 million in FY24.
- Net operating income surged by 50.34% YoY to USD 577.9 million in FY24.
- Net inflows doubled to USD 20.2 billion in FY24, significantly up from USD 10.2 billion in FY23.
- Funds under management (FUM) expanded by 26.9% YoY, reaching USD 153 billion by year-end.
GQG Partners Inc. (ASX:GQG), a global boutique asset management firm specialising in active equity portfolios, delivered 46.91% YoY surge in revenue in the financial year 2024 (FY24), reaching USD 760.4 million, up from USD 517.6 million in FY23. Net operating income in FY24 saw an even greater increase of 50.34% YoY to USD 577.9 million from USD 384.4 million in the previous year. Furthermore, net income attributable to GQG grew by 52.78% YoY to USD 431.6 million.
The revenue boost was driven by net inflows of USD 20.2 billion, nearly doubling the USD 10.2 billion recorded in FY23. By the end of December 2024, GQG’s funds under management (FUM) had expanded by 26.9% annually, reaching USD 153 billion.
The company declared a final dividend of USD 0.0378 per share, a 90% payout ratio of distributable earnings. Additionally, the GQG’s board has approved a broader dividend payout range of 50%–95%.
Executive Leadership Change
In a significant leadership update, GQG announced that CFO Melodie B. Zakaluk will retire from her position effective 1 January 2026. The company has initiated a search for her successor, with an appointment expected in due course.
Positive Outlook for FY24 and Beyond
The firm maintains a weighted average management fee of 49.6 basis points (bps), which reduces margin pressure compared to peers with higher fees. With over 96% of its revenues derived from asset-based fees, GQG expects continued revenue stability even amid market fluctuations.
The firm reported record-high FUM of USD 160.4 billion as of 31 January 2025, bolstered by year-to-date net inflows of USD 1.7 billion. Despite potential market volatility and geopolitical risks, GQG remains committed to strategic investments and adaptive strategies to drive future growth
Share performance of GQG
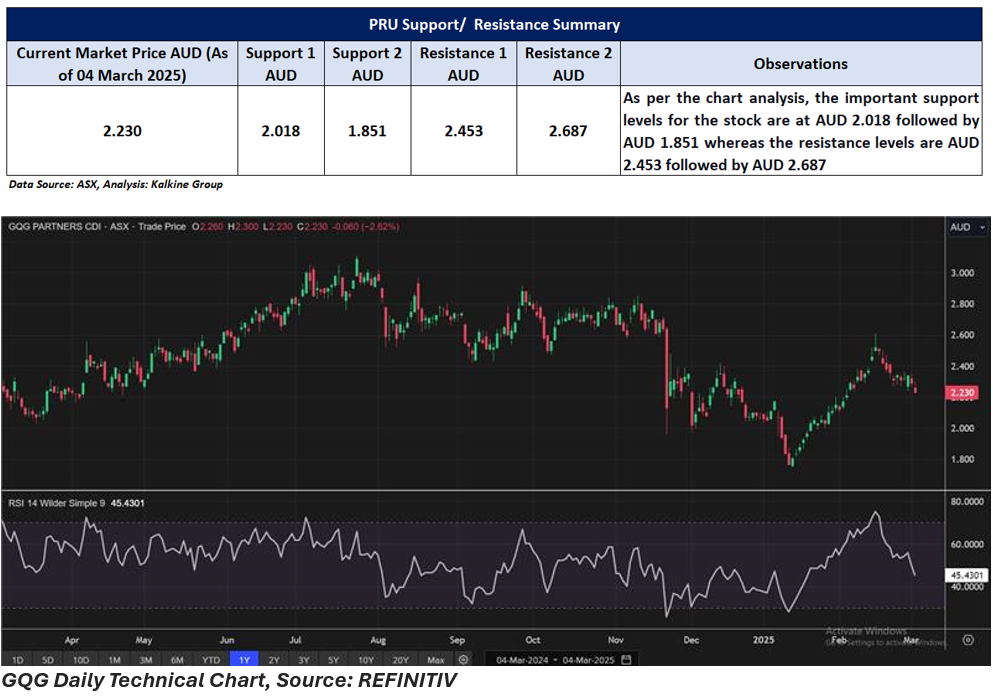
GQG shares closed 2.62% lower at AUD 2.23 per share on 4 March 2025. In the last three months, GQG’s share price increased by nearly 6.70%, while it has dropped by around 13.90% in the last nine months.
52-week high of GQG is AUD 3.11, recorded on 24 July 2024 and 52-week low is AUD 1.75, recorded on 14 January 2025.
Support and Resistance Summary
Note 1: Past performance is neither an Indicator nor a guarantee of future performance.
Note 2: The reference date for all price data, and currency, is 04 March 2025. The reference data in this report has been partly sourced from EODHD/Others.
Technical Indicators Defined:
Support: A level at which the stock prices tend to find support if they are falling, and a downtrend may take a pause backed by demand or buying interest. Support 1 refers to the nearby support level for the stock and if the price breaches the level, then Support 2 may act as the crucial support level for the stock.
Resistance: A level at which the stock prices tend to find resistance when they are rising, and an uptrend may take a pause due to profit booking or selling interest. Resistance 1 refers to the nearby resistance level for the stock and if the price surpasses the level, then Resistance 2 may act as the crucial resistance level for the stock.
Disclaimer
This article has been prepared by Kalkine Media, echoed on the website kalkinemedia.com/au and associated pages, based on the information obtained and collated from the subscription reports prepared by Kalkine Pty. Ltd. [ABN 34 154 808 312; AFSL no. 425376] on Kalkine.com.au (and associated pages). The principal purpose of the content is to provide factual information only for educational purposes. None of the content in this article, including any news, quotes, information, data, text, reports, ratings, opinions, images, photos, graphics, graphs, charts, animations, and video is or is intended to be, advisory in nature. The content does not contain or imply any recommendation or opinion intended to influence your financial decisions, including but not limited to, in respect of any particular security, transaction, or investment strategy, and must not be relied upon by you as such. The content is provided without any express or implied warranties of any kind. Kalkine Media, and its related bodies corporate, agents, and employees (Kalkine Group) cannot and do not warrant the accuracy, completeness, timeliness, merchantability, or fitness for a particular purpose of the content or the website, and to the extent permitted by law, Kalkine Group hereby disclaims any and all such express or implied warranties. Kalkine Group shall NOT be held liable for any investment or trading losses you may incur by using the information shared on our website.
