


Highlights
- GSS’ FY25 revenue rose 63% YoY to AUD 15.9 million, led by higher domestic respiratory sales.
- Q1 FY26 revenue of GSS reached AUD 5.4 million, marking the highest quarterly result since COVID.
- In FY25, the company secured its first U.S. commercial contract, expanding its international footprint.
Genetic Signatures Limited (ASX:GSS) is an Australian company specialising in molecular diagnostics. The company focuses on developing and marketing methods to detect unique genetic markers for various diseases and offers related products for use in diagnostic and research settings.
Financial Performance
For the financial year 2025 (FY25), the company reported sales revenue of AUD 15.9 million, up 63% YoY from AUD 9.8 million in FY24, driven by higher respiratory sales in the Australian market. International sales contributed 9.2% of total revenue, mainly from the UK and Ireland, while the gross margin improved to 55% from 53% in the previous year. During the reported period, the company also secured its first commercial contract in the US, opening a key market. EBITDA losses narrowed to AUD 15.8 million in FY25 from AUD 20.1 million in FY24. While the underlying loss decreased to AUD 12.7 million in FY25, compared to AUD 17.6 million in FY24.
Business Update
In the first quarter of FY26 (Q1FY26), GSS recorded its highest quarterly revenue since COVID, with unaudited sales of AUD 5.4 million, up 20% QoQ and 15% YoY, supported by performance in the US, EMEA, and Australia. Customer receipts totaled AUD 5.6 million, with a net operating cash outflow of AUD 2.1 million, ending the quarter with AUD 28.2 million in cash, including AUD 17.5 million in term deposits.
Key positives and Negatives
For FY25, the company recorded a gross margin of 56.7%, up from 44.6% in FY24, and an asset turnover ratio reached 0.35x, compared to 0.25x in the previous year. However, the return on equity was negative at 36.2% in FY25, compared with 15.1% of industry median. The cash cycle length also increased significantly to 340.9 days in FY25 compared to 147.7 days industry median.
Business Outlook
GSS is gaining momentum in the U.S. through a refined go-to-market strategy, including new contracts with major healthcare systems, targeted state-level initiatives, and increased visibility via conferences and digital outreach, supporting potential revenue growth in FY26. In EMEA, demand for the EasyScreen™ GI portfolio is rising, particularly within NHS hospital networks, while ongoing partnerships and new distribution agreements are expected to boost regional sales.
Share performance of GSS
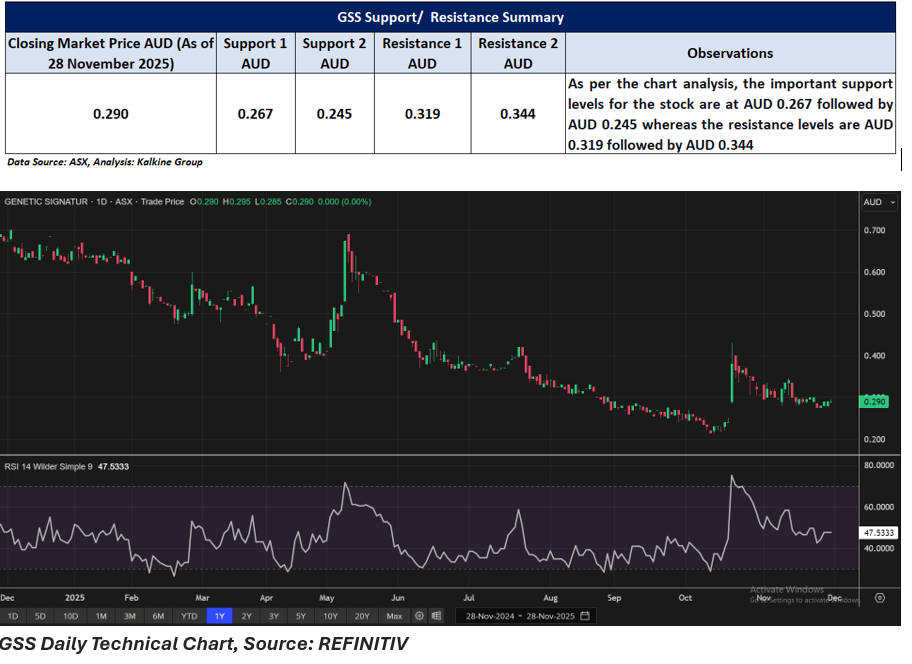
GSS shares remained steady at AUD 0.290 on 28 November 2025. Over the past year, the stock has fallen 57.97%, with declines of 39.58% over six months and 48.21% across nine months. The three-month performance shows a more positive trend with a 7.41% rise, although the stock is down 14.71% over the past month.
The 52-week high for GSS is AUD 0.700, reached on 3 December 2024, whereas the 52-week low stands at AUD 0.215, recorded on 14 October 2025.
Support and Resistance Summary
Note 1: Past performance is neither an Indicator nor a guarantee of future performance.
Note 2: The reference date for all price data, and currency, is 28 November 2025. The reference data in this report has been partly sourced from EODHD/Others.
Technical Indicators Defined:
Support: A level at which the stock prices tend to find support if they are falling, and a downtrend may take a pause backed by demand or buying interest. Support 1 refers to the nearby support level for the stock and if the price breaches the level, then Support 2 may act as the crucial support level for the stock.
Resistance: A level at which the stock prices tend to find resistance when they are rising, and an uptrend may take a pause due to profit booking or selling interest. Resistance 1 refers to the nearby resistance level for the stock and if the price surpasses the level, then Resistance 2 may act as the crucial resistance level for the stock.
Disclaimer
This article has been prepared by Kalkine Media, echoed on the website kalkinemedia.com/au and associated pages, based on the information obtained and collated from the subscription reports prepared by Kalkine Pty. Ltd. [ABN 34 154 808 312; AFSL no. 425376] on Kalkine.com.au (and associated pages). The principal purpose of the content is to provide factual information only for educational purposes. None of the content in this article, including any news, quotes, information, data, text, reports, ratings, opinions, images, photos, graphics, graphs, charts, animations, and video is or is intended to be, advisory in nature. The content does not contain or imply any recommendation or opinion intended to influence your financial decisions, including but not limited to, in respect of any particular security, transaction, or investment strategy, and must not be relied upon by you as such. The content is provided without any express or implied warranties of any kind. Kalkine Media, and its related bodies corporate, agents, and employees (Kalkine Group) cannot and do not warrant the accuracy, completeness, timeliness, merchantability, or fitness for a particular purpose of the content or the website, and to the extent permitted by law, Kalkine Group hereby disclaims any and all such express or implied warranties. Kalkine Group shall NOT be held liable for any investment or trading losses you may incur by using the information shared on our website.
