
.png)


Highlights
- DRR’s revenue dropped by 5.55% to AUD 112.3 mn in H1FY25 due to lower iron ore prices.
- The company has maintained EBITDA margins at 94% in H1FY25, driven by low-cost operations and high productivity at core assets.
- Director Graeme Devlin has recently acquired 20,010 shares of DRR for AUD 79,919 and Director Jennifer Seabrook has purchased 10,000 shares for AUD 35,689.69.
- Multiple initiatives in H1FY25 are expected to yield additional synergies in H2FY25 and FY26.
Deterra Royalties Limited (ASX:DRR) is an ASX-listed company that focuses on developing its portfolio of royalty assets across a range of commodities. Despite encountering some revenue headwinds in the first half of the financial year 2025 (H1FY25), DRR continues to build on its royalty model, pursue strategic acquisitions, and enhance its exposure to emerging opportunities in the battery and base metals sectors.
On 3 March 2025, DRR announced changes to its directors’ interests, with director Graeme Devlin acquiring 20,010 shares on 27 and 28 February 2025 for AUD 79,919. Meanwhile, director Jennifer Seabrook purchased 10,000 shares on 28 February 2025 for AUD 35,689.69.
Financial Highlights
|
Indicator |
H1FY25 (AUD) |
H1FY24 (AUD) |
% Change |
|
Total Revenue |
112.3 mn |
118.9 mn |
-5.55% |
|
EBITDA |
94.0 mn |
113.0 mn |
-17.03% |
|
Underlying NPAT |
68.5 mn |
78.4 mn |
-12.6% |
The company’s revenue dropped in H1FY25 due to lower iron ore prices. The period saw record sales volumes from Mining Area C and AUD 7.2 million in revenue from a newly acquired gold offtake portfolio.
Margin Maintenance in H1FY25
The company has maintained EBITDA margins at 94% in H1FY25. The company remains confident in sustaining these healthy margins through FY25 on the back of the low-cost nature of DRR’s operations and the high productivity at its core assets, notably Mining Area C.
Multiple efficiency initiatives were undertaken in H1FY25 and are expected to deliver synergies in H2FY25 and in FY26.
Growth in Battery and Base Metals Exposure
The integration of lithium and copper royalties from the Trident portfolio has positioned DRR to benefit in the battery metals markets. A notable highlight is the Thacker Pass lithium project in the United States, which is set to significantly increase DRR’s exposure to the burgeoning lithium market.
Share performance of DRR
DRR shares closed 1.38% lower at AUD 3.58 on 5 March 2025. Over the past year, DRR’s share price has dropped by nearly 27.24% and in a month, it has decreased by 11.82%.
52-week high of DRR is AUD 5.11, recorded on 4 March 2024 and 52-week low is AUD 3.32, recorded on 9 September 2024.
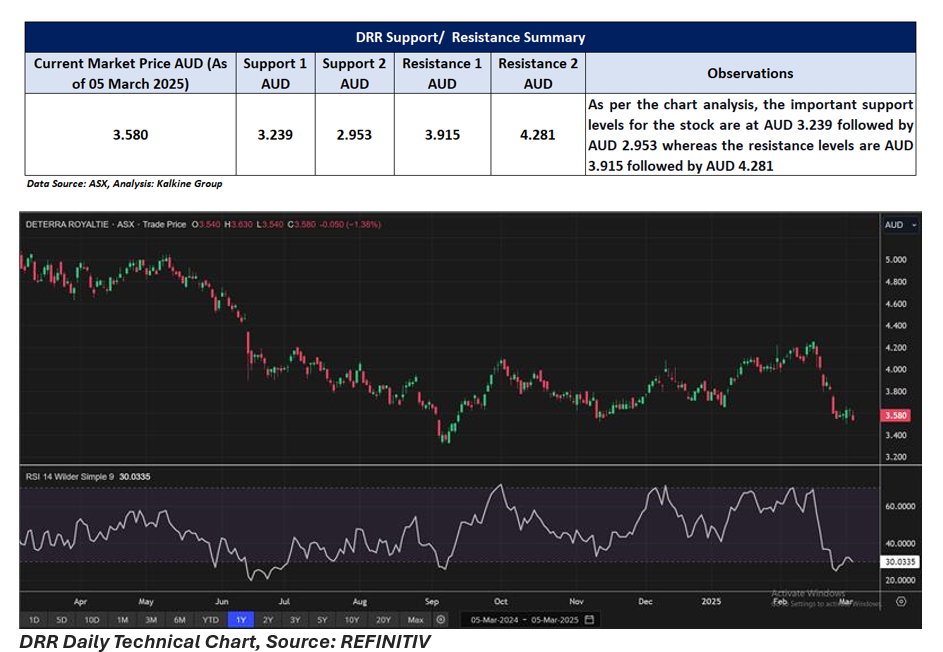
Support and Resistance Summary
Note 1: Past performance is neither an Indicator nor a guarantee of future performance.
Note 2: The reference date for all price data, and currency, is 05 March 2025. The reference data in this report has been partly sourced from EODHD/Others.
Technical Indicators Defined:
Support: A level at which the stock prices tend to find support if they are falling, and a downtrend may take a pause backed by demand or buying interest. Support 1 refers to the nearby support level for the stock and if the price breaches the level, then Support 2 may act as the crucial support level for the stock.
Resistance: A level at which the stock prices tend to find resistance when they are rising, and an uptrend may take a pause due to profit booking or selling interest. Resistance 1 refers to the nearby resistance level for the stock and if the price surpasses the level, then Resistance 2 may act as the crucial resistance level for the stock.
Disclaimer
This article has been prepared by Kalkine Media, echoed on the website kalkinemedia.com/au and associated pages, based on the information obtained and collated from the subscription reports prepared by Kalkine Pty. Ltd. [ABN 34 154 808 312; AFSL no. 425376] on Kalkine.com.au (and associated pages). The principal purpose of the content is to provide factual information only for educational purposes. None of the content in this article, including any news, quotes, information, data, text, reports, ratings, opinions, images, photos, graphics, graphs, charts, animations, and video is or is intended to be, advisory in nature. The content does not contain or imply any recommendation or opinion intended to influence your financial decisions, including but not limited to, in respect of any particular security, transaction, or investment strategy, and must not be relied upon by you as such. The content is provided without any express or implied warranties of any kind. Kalkine Media, and its related bodies corporate, agents, and employees (Kalkine Group) cannot and do not warrant the accuracy, completeness, timeliness, merchantability, or fitness for a particular purpose of the content or the website, and to the extent permitted by law, Kalkine Group hereby disclaims any and all such express or implied warranties. Kalkine Group shall NOT be held liable for any investment or trading losses you may incur by using the information shared on our website.
