


Highlights
- Credit Corp reported FY25 revenue of AUD 545.6 million, a 5% YoY increase.
- Underlying NPAT (pre-impairment) rose 16% YoY to AUD 94.1 million.
- Q1FY26 US collections increased 22% YoY, with an investment pipeline of AUD 145 million.
- FY26 guidance maintained, with ledger investments forecast at AUD 280–330 million and NPAT expected at AUD 100–110 million.
Credit Corp Group Limited (ASX:CCP) is an ASX-listed company engaged in debt purchasing, collections, and consumer lending across Australia, the United States, and New Zealand, and reported stable progress for the financial year ended June 2025. The company generated revenue of AUD 545.6 million, representing a 5% increase compared to the previous year. Its consumer lending division delivered encouraging earnings, supported by a recovery in lending activity that stabilised after years of post-COVID deleveraging.
The company’s US debt purchasing business also recorded solid results, benefiting from higher collections performance and improved productivity. Underlying NPAT (pre-impairment) rose 16% YoY to AUD 94.1 million, compared with AUD 81.2 million in FY24.
Q1FY26 Update Shows Momentum
In the United States, the company began FY26 with a 22% uplift in collections during the first quarter, supported by an investment pipeline valued at AUD 145 million. The company confirmed that its full-year guidance remains unchanged. In Australia and New Zealand, lending activity continued to strengthen, underpinned by increased customer acquisition and record quarterly volumes, which were 3% higher than the previous year.
Local debt purchasing volumes were broadly in line with the prior year, despite reduced overall investment levels. The company highlighted an expected AUD 60 million pipeline, which is forecast to exceed AUD 80 million for FY26.
Credit Corp also reaffirmed its FY26 guidance, projecting ledger investments of AUD 280–330 million and gross lending between AUD 350–390 million. NPAT expectations remain steady at AUD 100–110 million, representing 6–17% growth compared with FY25.
Economic Indicators Provide Constructive Backdrop
According to the seasonally adjusted, chain-volume data by the ABS (03 December 2925), Australia’s GDP grew 0.4% in the September 2025 quarter, marking a 2.1% increase over the year. Although GDP per capita was flat for the quarter due to population growth matching economic expansion, it remained 0.4% higher than a year earlier.
Household financial resilience has also strengthened. The household saving-to-income ratio rose to 6.4% in the September quarter, up from 6.0% in June. Gross disposable income advanced 1.7%, outpacing a 1.4% rise in household spending.
Share Performance of CCP
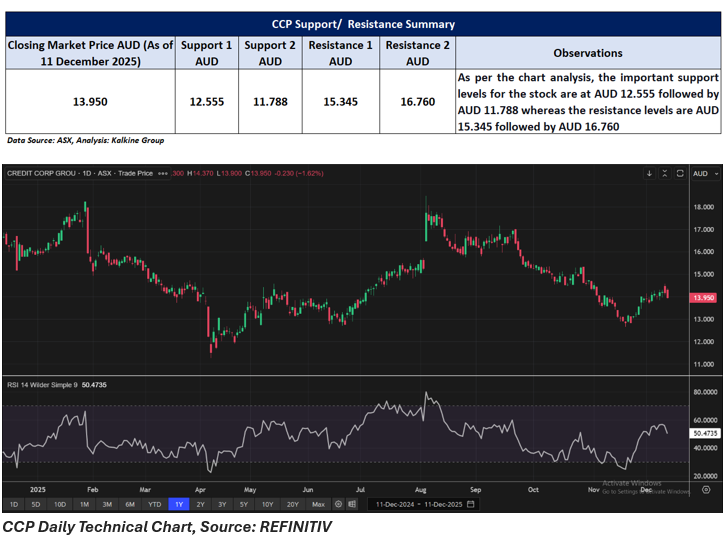
CCP shares closed at AUD 13.950 per share, down 1.62% intraday on 11 December 2025. Over the past year, the stock has decreased significantly by 16.27%. It showed mixed performance in shorter periods, rising 0.43% over one month and 1.45% over six months, while falling 1.27% over one week and 1.41% over nine months.
The 52-week high for CCP is AUD 18.480, recorded on 5 August 2025, while the 52-week low is AUD 11.275, reached on 7 April 2025.
Support and Resistance Summary
Note 1: Past performance is neither an Indicator nor a guarantee of future performance.
Note 2: The reference date for all price data, and currency, is 11 December 2025. The reference data in this report has been partly sourced from EODHD/Others.
Technical Indicators Defined:
Support: A level at which the stock prices tend to find support if they are falling, and a downtrend may take a pause backed by demand or buying interest. Support 1 refers to the nearby support level for the stock and if the price breaches the level, then Support 2 may act as the crucial support level for the stock.
Resistance: A level at which the stock prices tend to find resistance when they are rising, and an uptrend may take a pause due to profit booking or selling interest. Resistance 1 refers to the nearby resistance level for the stock and if the price surpasses the level, then Resistance 2 may act as the crucial resistance level for the stock.
Disclaimer
This article has been prepared by Kalkine Media, echoed on the website kalkinemedia.com/au and associated pages, based on the information obtained and collated from the subscription reports prepared by Kalkine Pty. Ltd. [ABN 34 154 808 312; AFSL no. 425376] on Kalkine.com.au (and associated pages). The principal purpose of the content is to provide factual information only for educational purposes. None of the content in this article, including any news, quotes, information, data, text, reports, ratings, opinions, images, photos, graphics, graphs, charts, animations, and video is or is intended to be, advisory in nature. The content does not contain or imply any recommendation or opinion intended to influence your financial decisions, including but not limited to, in respect of any particular security, transaction, or investment strategy, and must not be relied upon by you as such. The content is provided without any express or implied warranties of any kind. Kalkine Media, and its related bodies corporate, agents, and employees (Kalkine Group) cannot and do not warrant the accuracy, completeness, timeliness, merchantability, or fitness for a particular purpose of the content or the website, and to the extent permitted by law, Kalkine Group hereby disclaims any and all such express or implied warranties. Kalkine Group shall NOT be held liable for any investment or trading losses you may incur by using the information shared on our website.
