


Highlights
- Barclays’ total income jumped to GBP 6,258 million in Q3 FY23 from GBP 5,951 million in the previous corresponding period.
- The bank’s profit before tax increased to £5,190 million during 9M FY23, marking around 13% YoY growth.
FTSE 100 Index listed Barclays PLC (LSE:BARC) offers consumer banking and payments services across the globe, along with global corporate and investment banking services.
In the third quarter of 2023, the company’s total income rose to GBP 6,258 million from GBP 5,951 million in the previous corresponding period. Barclays registered a 5% year-on-year growth in its income to £19,780 million for the 9M FY23. Also, the profit before tax of the company increased to £5,190 million during 9M FY23, marking around 13% YoY growth.
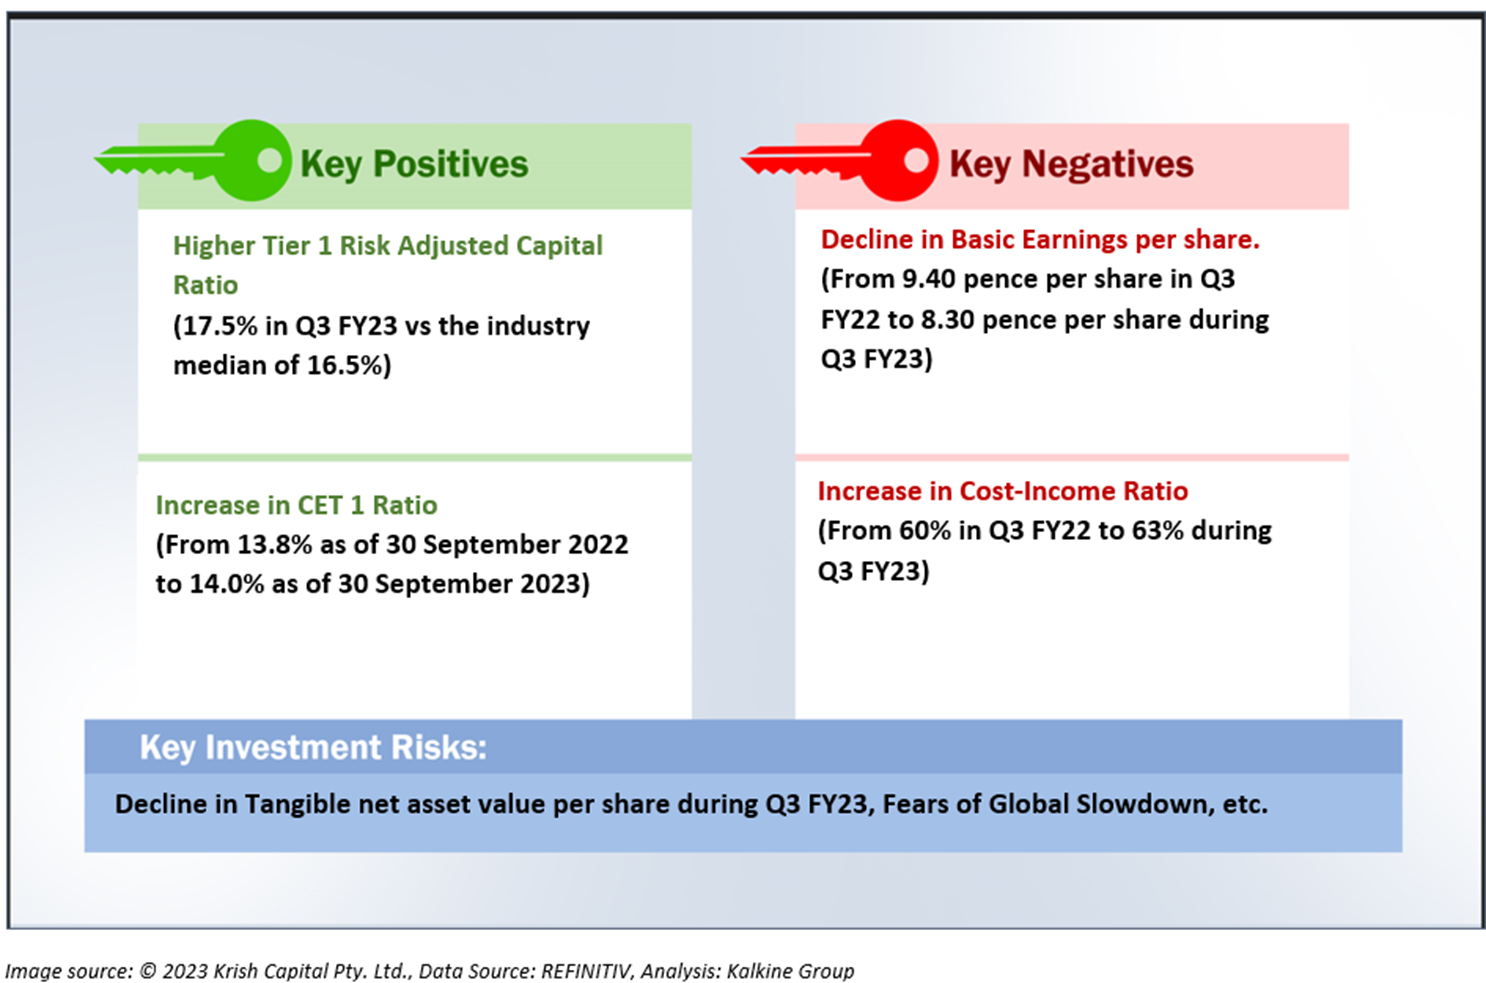
At the end of third quarter, the bank’s CET1 capital ratio stood at 14.0%, with £341.9 billion risk weighted assets (RWAs) and tangible net asset value (TNAV) per share of 316 pence.
In the first half of the fiscal year 2023, the interim dividend per share of the company recorded a 20% year-on-year increase.
The Group's Return on Tangible Equity (RoTE) stood at 11% and 12.5% for Q3 FY23 and 9M FY23, respectively. Also, the bank’s balance sheet reflected a 14% CET1 ratio for the reporting period.
For the full year 2023, Barclays is expecting its cost to income ratio percentage to be in around 60. Also, based on current macroeconomic outlook, the bank’s loan loss rate is likely to be between 50 and 60 basis points in FY23.
For the medium term, Barclays is likely to operate within the 13-14% CET1 ratio target range, with a cost to income ratio under 0.60.
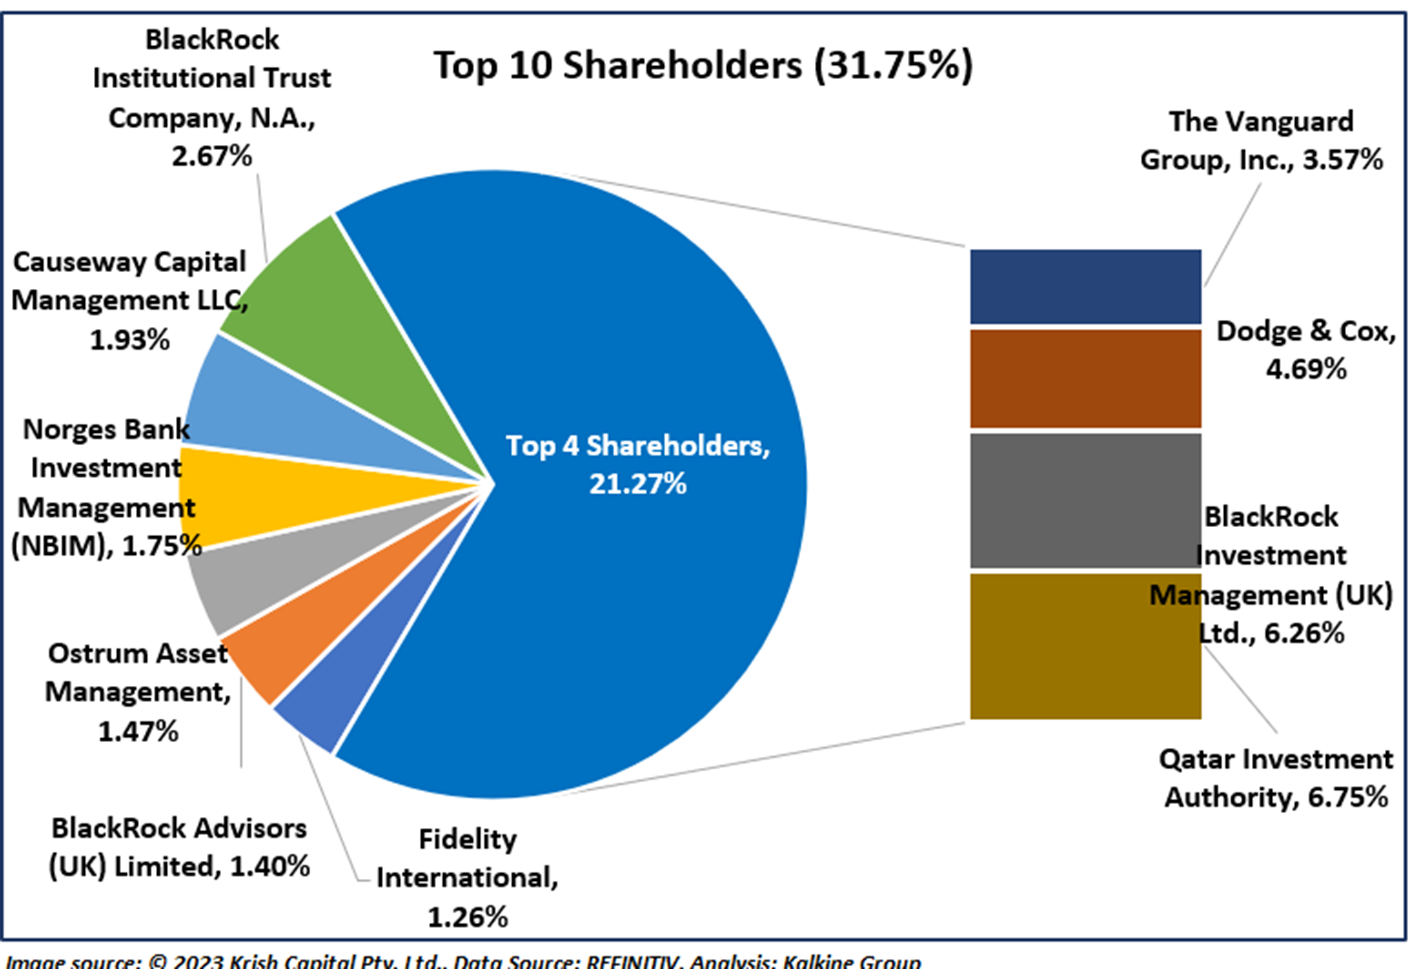
Top 10 Shareholders
Around 31.75% of the total shareholdings is held by the company’s top ten shareholders. While Qatar Investment Authority owns approximately 6.75% shares in BARC, BlackRock Investment Management (UK) Ltd. holds 6.26% shareholding in the firm.
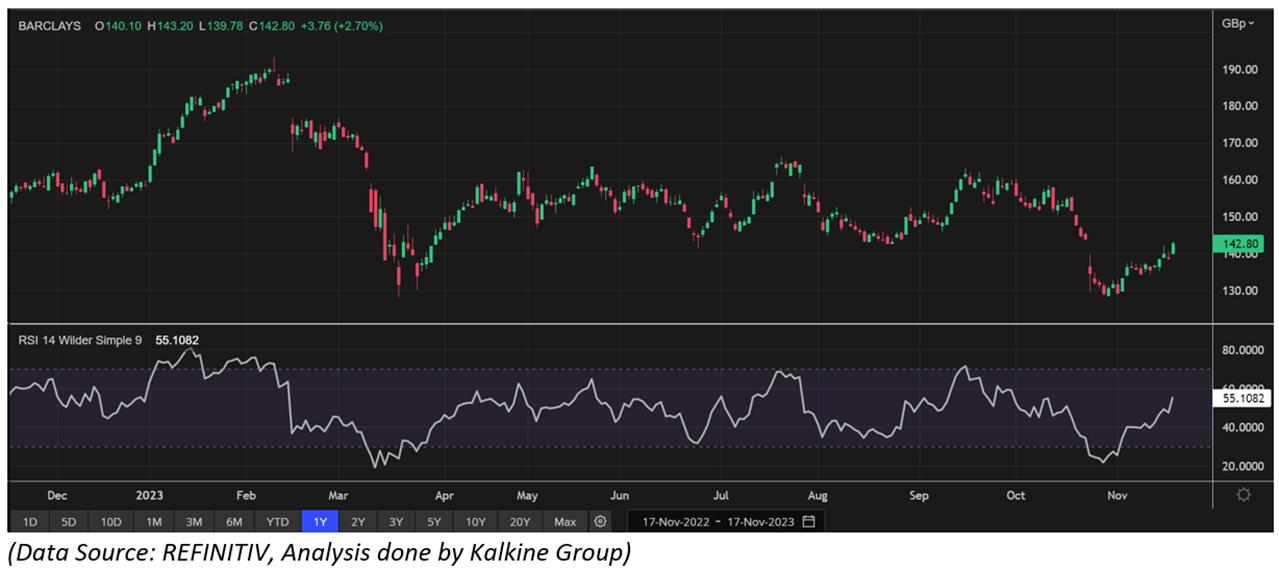
Stock Price Performance
BARC’s stock price has experienced a drop of over 1.5% in the last one month. It has declined by around 10.59% over the last six months. The stock’s 52-week low and high price stand at GBX 128.12 and GBX 198.86, respectively.
Note 1: Past performance is not a reliable indicator of future performance.
Note 2: The reference data for all price data, currency, technical indicators, support, and resistance levels is 17 November 2023. The reference data in this report has been partly sourced from EODHD/Others.
