


Highlights
- PNV’s FY25 revenue increased 23% to AUD 129.2 million, driven by product sales.
- In FY25, NovoSorb product sales grew 28.9%, with notable growth in both U.S. and international markets.
- The company expects continued momentum driven by NovoSorb BTM and MTX growth.
PolyNovo Limited (ASX:PNV) is a medical device company focused on wound care products. The company designs, develops, and produces dermal regeneration devices, including NovoSorb® BTM and NovoSorb® MTX, based on its patented NovoSorb biodegradable polymer technology. Its development activities cover applications in breast sling, hernia, and orthopaedic areas.
Financial Updates
In financial year 2025 (FY25), PNV has reported total revenue of AUD 129.2 million, up 23.3% from AUD 104.8 million in FY24. Sales of NovoSorb products rose 28.9% YoY to AUD 118.6 million in FY25, with U.S. sales increasing 28.7% and Rest of World sales up 29.6%.
Cash and cash equivalents were AUD 33.5 million as of 30 June 2025, and operating cash flow improved to AUD 15.6 million in 2HFY25, resulting in a full-year inflow of AUD 3.1 million.
In FY25, profit after tax increased 151.2% YoY to AUD 13.2 million, while EBITDA rose 211.1% YoY to AUD 11.2 million.
Business Update
On 30 September, the company clarified that its U.S.-sold devices, NovoSorb BTM and NovoSorb MTX, are classified as medical devices and subject to a 10% tariff rather than the 100% pharmaceutical tariff. Therefore, no material impact is expected from the US tariff.
On 12 September, PNV reported positive results from a post-market randomised controlled trial on NovoSorb BTM for post-surgical diabetes-related foot wounds. The trial showed 66.7% wound healing with BTM versus 56.5% with standard care, and larger wounds over 10 cm² healed faster (191 days versus 319 days), with no difference in amputation rates.
Key Positives and Negatives
In FY25, the company reported an increase in return on equity, rising to 17% from 7.7% in FY24, alongside an improvement in EBITDA margin, which grew to 6.7% from 5.2% the previous year. However, the inventory turnover ratio declined to 0.4x from 0.8x, and the current ratio decreased to 2.77x from 3.41x over the same period.
Company Outlook
The company expects continued growth in demand of NovoSorb BTM across wound and burn indications, Growth in NovoSorb MTX is expected to be driven by the U.S. launch of the 6mm version. Completion of the BARDA Pivotal Clinical Trial and PMA submission, along with reimbursement strategies and new clinical data, positions the company for further market expansion.
The company aims to accelerate geographic growth, enhance pipeline productivity, and explore strategic opportunities. FY26 cash flow growth is anticipated, supported by profit momentum, the new manufacturing facility, expanded sales force, and operational efficiency, with minimal impact from U.S. tariffs.
Share Performance of PNV
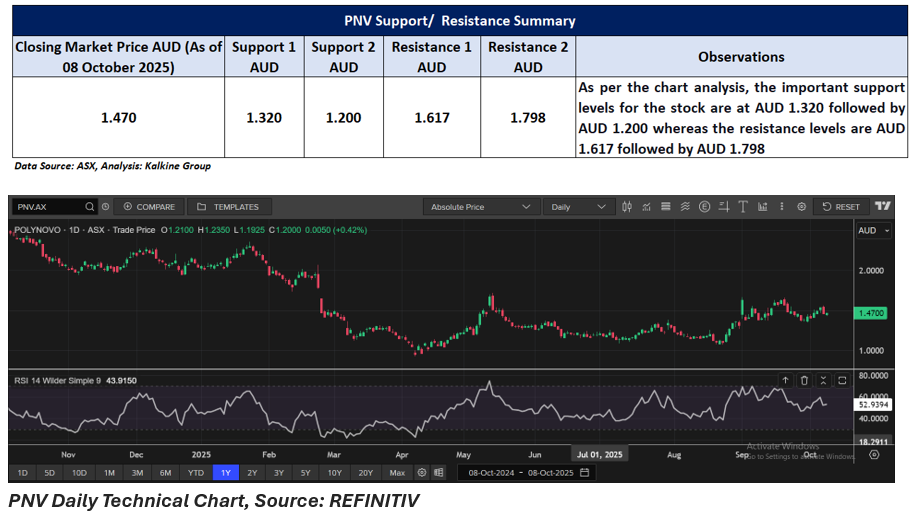
On 8 October 2025, PNV closed at AUD 1.470 per share, down 0.68% intraday. Over the last year, the share price fell 40.48%, while it rose 52.33% over the past six months and 29.51% in the past three months. The stock’s 52-week high is AUD 2.540, recorded on 7 October 2024, and the 52-week low is AUD 0.930, reached on 7 April 2025.
Support and Resistance Summary
Note 1: Past performance is neither an Indicator nor a guarantee of future performance.
Note 2: The reference date for all price data, and currency, is 08 October 2025. The reference data in this report has been partly sourced from EODHD/Others.
Technical Indicators Defined:
Support: A level at which the stock prices tend to find support if they are falling, and a downtrend may take a pause backed by demand or buying interest. Support 1 refers to the nearby support level for the stock and if the price breaches the level, then Support 2 may act as the crucial support level for the stock.
Resistance: A level at which the stock prices tend to find resistance when they are rising, and an uptrend may take a pause due to profit booking or selling interest. Resistance 1 refers to the nearby resistance level for the stock and if the price surpasses the level, then Resistance 2 may act as the crucial resistance level for the stock.
Disclaimer
This article has been prepared by Kalkine Media, echoed on the website kalkinemedia.com/au and associated pages, based on the information obtained and collated from the subscription reports prepared by Kalkine Pty. Ltd. [ABN 34 154 808 312; AFSL no. 425376] on Kalkine.com.au (and associated pages). The principal purpose of the content is to provide factual information only for educational purposes. None of the content in this article, including any news, quotes, information, data, text, reports, ratings, opinions, images, photos, graphics, graphs, charts, animations, and video is or is intended to be, advisory in nature. The content does not contain or imply any recommendation or opinion intended to influence your financial decisions, including but not limited to, in respect of any particular security, transaction, or investment strategy, and must not be relied upon by you as such. The content is provided without any express or implied warranties of any kind. Kalkine Media, and its related bodies corporate, agents, and employees (Kalkine Group) cannot and do not warrant the accuracy, completeness, timeliness, merchantability, or fitness for a particular purpose of the content or the website, and to the extent permitted by law, Kalkine Group hereby disclaims any and all such express or implied warranties. Kalkine Group shall NOT be held liable for any investment or trading losses you may incur by using the information shared on our website.
