
_11_05_2025_12_41_50_410688.png)


Highlights
- NST reported FY25 revenue of AUD 6.4 billion with 1.63 million ounces sold.
- NST’s Q1 FY26 gold sales reached 381,055 ounces at an AISC of AUD 2,522/oz.
- The company FY26 capital expenditure is guided at AUD 2.125–2.270 billion including KCGM and Hemi projects
Northern Star Resources Ltd (ASX:NST) is a major Australian gold producer with operations and exploration projects both in Western Australia and Alaska. The company is involved in the discovery, development, extraction, and processing of gold, as well as the sale of refined gold.
Financial Update
In the financial year 2025 (FY25), the company reported revenue of AUD 6.4 billion, 30% increase, supported by 29% rise in the an average gold price of AUD 3,922 per ounce and gold sales of 1.63 million ounces. During the same period, underlying EBIT was AUD 2,136 million, up by 102% YoY. In FY25 underlying NPAT increased 105% YoY to AUD 1,415 millionand underlying EBITDA jumped 60% YoY to AUD 3.5 billion in FY25. Operating cash flow rose 43% yoY to AUD 3 billion inFY25, and the company held AUD 1,914 million in cash and bullion up 53% YoY. During the year, an AUD 300 million share buy-back was completed, and dividends of 55 cents per share were paid. Capital investments continued in the KCGM mill expansion and Hemi development projects.
Business Update
On 23 October 2025, NST released its Q1 FY26 report. During the quarter, the company sold 381,055 ounces of gold at an AISC of AUD 2,522/oz. Gold sales by site were 203koz at Kalgoorlie (AISC AUD 2,474/oz), 113koz at Yandal (AISC AUD 2,778/oz), and 65koz at Pogo (AISC USD 1,453/oz). The KCGM Mill Expansion is scheduled for commissioning in early FY27. The quarter recorded AUD 14 million in free cash flow, with net mine cash flow of AUD 183 million. Cash and bullion holdings were AUD 1.511 billion, with an undrawn AUD 1.5 billion bank facility.
On 25 September 2025, JPMorgan Chase & Co. reported a holding of 129 million shares (9.02%) in NST.
Key positive and Negative
In FY25, the company reported an EBITDA margin of 53.9% compared to the industry average of 35.7%, and a net margin of 20.9%, compared with the industry medians of 10.4%. However, its gross margin stood at 35.4% in FY25, below the industry median of 46.3%. For FY26, the company expects an inflationary impact of approximately 5% across its global portfolios.
Business Outlook
For FY26, NST expects gold sales of 1.7–1.85 million ounces, with Kalgoorlie at 930–1,000koz, Yandal 500–550koz, and Pogo 270–300koz. KCGM is forecast to deliver 550–600koz through increased underground and open pit productivity. All-in sustaining costs (AISC) are projected at AUD 2,300–2,700/oz, reflecting inflation, higher royalties, and sustaining capital, with costs expected to improve as grades and volumes rise. Growth capital investment is guided at AUD 2.125–2.270 billion, including the KCGM Mill Expansion (AUD 530–550 million), its operational readiness (AUD 315–370 million), and the Hemi Development Project (AUD 140–150 million).
Share Performance of NST
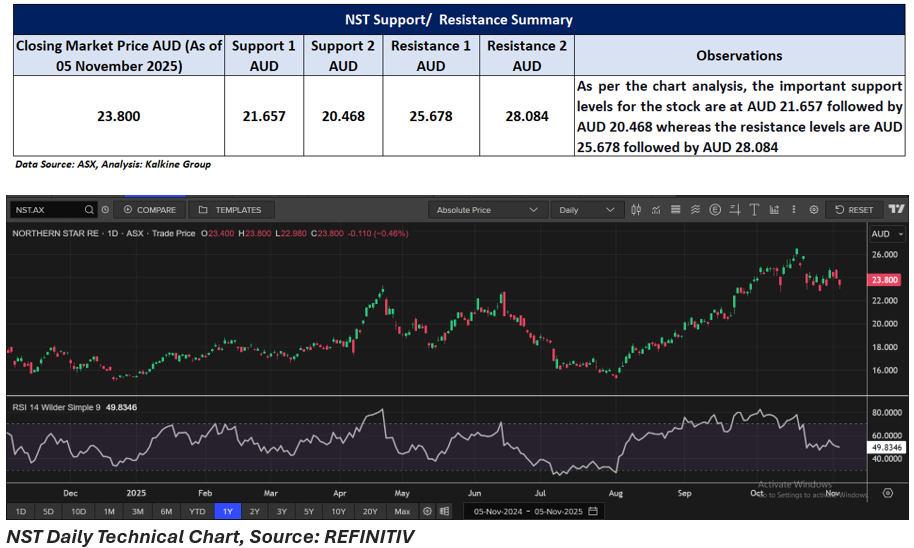
NST’s shares were trading at AUD 23.800 per share on 05 November 2025 with intraday loss of 0.46%. NST’s stock up by 38.93% in last three months as well as up by 22.49% over the six months and jumped 34.31% over the past year. NST’s 52 week high is AUD 26.52, recorded on 17 October 2025 and 52-week low is AUD 15.060, recorded on 19 December 2024.
Support and Resistance Summary
Note 1: Past performance is neither an Indicator nor a guarantee of future performance.
Note 2: The reference date for all price data, and currency, is 05 November 2025. The reference data in this report has been partly sourced from EODHD/Others.
Technical Indicators Defined:
Support: A level at which the stock prices tend to find support if they are falling, and a downtrend may take a pause backed by demand or buying interest. Support 1 refers to the nearby support level for the stock and if the price breaches the level, then Support 2 may act as the crucial support level for the stock.
Resistance: A level at which the stock prices tend to find resistance when they are rising, and an uptrend may take a pause due to profit booking or selling interest. Resistance 1 refers to the nearby resistance level for the stock and if the price surpasses the level, then Resistance 2 may act as the crucial resistance level for the stock.
Disclaimer
This article has been prepared by Kalkine Media, echoed on the website kalkinemedia.com/au and associated pages, based on the information obtained and collated from the subscription reports prepared by Kalkine Pty. Ltd. [ABN 34 154 808 312; AFSL no. 425376] on Kalkine.com.au (and associated pages). The principal purpose of the content is to provide factual information only for educational purposes. None of the content in this article, including any news, quotes, information, data, text, reports, ratings, opinions, images, photos, graphics, graphs, charts, animations, and video is or is intended to be, advisory in nature. The content does not contain or imply any recommendation or opinion intended to influence your financial decisions, including but not limited to, in respect of any particular security, transaction, or investment strategy, and must not be relied upon by you as such. The content is provided without any express or implied warranties of any kind. Kalkine Media, and its related bodies corporate, agents, and employees (Kalkine Group) cannot and do not warrant the accuracy, completeness, timeliness, merchantability, or fitness for a particular purpose of the content or the website, and to the extent permitted by law, Kalkine Group hereby disclaims any and all such express or implied warranties. Kalkine Group shall NOT be held liable for any investment or trading losses you may incur by using the information shared on our website.
