
_10_16_2025_13_04_32_196592.png)


Highlights
- NGI’s FY25 revenue rose 27% YoY to USD 435.6 mn, driven by recurring fees.
- Statutory NPAT surged 80% YoY to USD 119.4 mn in FY25.
- In FY25, NGI’s ownership-adjusted AUM grew 6% YoY to USD 27.7 bn, supported by Lighthouse Partners
Navigator Global Investments Limited (ASX:NGI) invests in alternative asset management companies worldwide. Through its subsidiary, Lighthouse Investment Partners, LLC, it offers global investment services and holds strategic minority stakes.
Financial Update
In the financial year 2025 (FY25), the company reported revenue of USD 435.6 mn, up from USD 341.8 mn in FY24, reflecting a 27% YoY increase. Revenue was driven byr recurring management and performance fees and investment performance across partner firms. During the same period, adjusted EBITDA increased 26% YoY, reflecting AUM growth, operating margins of 56%, and cost management, supported by distributions from Lighthouse and NGI Strategic. Statutory NPAT rose to USD 119.4 mn in FY25 from USD 66.3 mn in FY24, an 80% YoY increase. In the same period ownership-adjusted AUM increased to USD 27.7 bn from USD 26.2 bn in FY 24, a 6% YoY rise.
Business Update
In September 2025, NGI reported a 3% quarterly rise in total firm-level AUM, reaching USD 87 bn, while ownership-adjusted AUM increased 4.5% to USD 29 bn. Meanwhile, total firm-level AUM grew 13.7% YoY and ownership-adjusted AUM rose 9.0%. The growth was supported by investment performance across partner firms, notably Lighthouse Partners, whose AUM climbed 6.9% to USD 17 bn. Private Markets AUM within NGI Strategic rose 7.7%, driven by continued fundraising and inflows into higher fee-yielding strategies.
Key Negatives
In FY25, the company reported decline in current ratio to 0.94x in FY25 from 0.96x in FY24, while the cash cycle increased to 35.5 days in FY25 from 35.1 days in FY24.
Business Outlook
NGI expects EBITDA growth in FY26 underpinned by partner firm performance, fee-based income, high-yielding strategies and private market exposure. The company is pursuing selective acquisitions and partnerships to diversify its portfolio and drive incremental earnings growth across all platforms.
NGI Strategic Partner Firms are expected to maintain AUM growth through fundraising and investment performance.
Share Performance
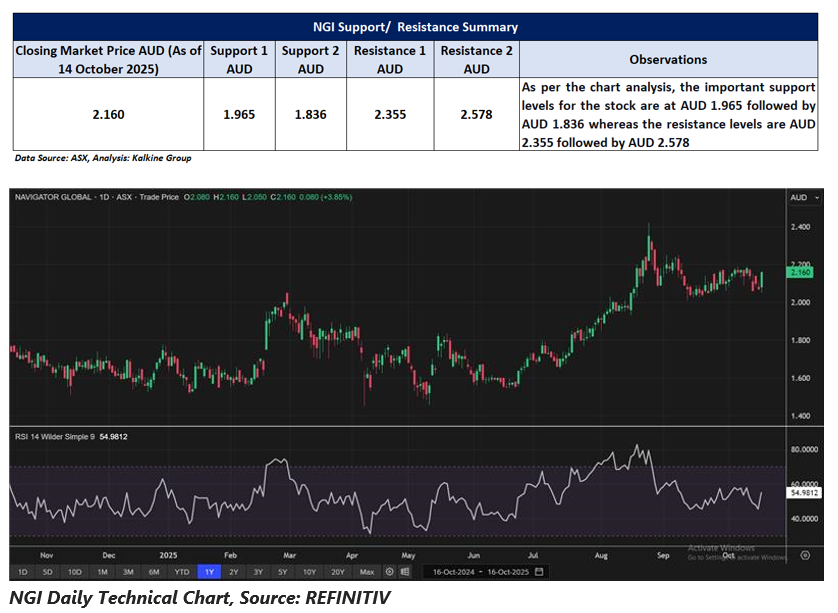
The NGI’s shares traded at AUD 2.160 per share on 16 October 2025, recording an intraday gain of 3.85%. The stock has risen 24.85% over the past three months, 22.72% in the last six months, and 22.37% over the past year. NGI’s 52-week high is AUD 2.42, recorded on 25 August 2025, while the 52-week low is AUD 1.45, recorded on 7 April 2025.
Support and Resistance Summary
Note 1: Past performance is neither an Indicator nor a guarantee of future performance.
Note 2: The reference date for all price data, and currency, is 16 October 2025. The reference data in this report has been partly sourced from EODHD/Others.
Technical Indicators Defined:
Support: A level at which the stock prices tend to find support if they are falling, and a downtrend may take a pause backed by demand or buying interest. Support 1 refers to the nearby support level for the stock and if the price breaches the level, then Support 2 may act as the crucial support level for the stock.
Resistance: A level at which the stock prices tend to find resistance when they are rising, and an uptrend may take a pause due to profit booking or selling interest. Resistance 1 refers to the nearby resistance level for the stock and if the price surpasses the level, then Resistance 2 may act as the crucial resistance level for the stock.
Disclaimer
This article has been prepared by Kalkine Media, echoed on the website kalkinemedia.com/au and associated pages, based on the information obtained and collated from the subscription reports prepared by Kalkine Pty. Ltd. [ABN 34 154 808 312; AFSL no. 425376] on Kalkine.com.au (and associated pages). The principal purpose of the content is to provide factual information only for educational purposes. None of the content in this article, including any news, quotes, information, data, text, reports, ratings, opinions, images, photos, graphics, graphs, charts, animations, and video is or is intended to be, advisory in nature. The content does not contain or imply any recommendation or opinion intended to influence your financial decisions, including but not limited to, in respect of any particular security, transaction, or investment strategy, and must not be relied upon by you as such. The content is provided without any express or implied warranties of any kind. Kalkine Media, and its related bodies corporate, agents, and employees (Kalkine Group) cannot and do not warrant the accuracy, completeness, timeliness, merchantability, or fitness for a particular purpose of the content or the website, and to the extent permitted by law, Kalkine Group hereby disclaims any and all such express or implied warranties. Kalkine Group shall NOT be held liable for any investment or trading losses you may incur by using the information shared on our website.
