
_07_18_2025_08_40_30_319217.png)


Highlights
- INA reported 21% YoY revenue growth to AUD 256.9 million in H1FY25.
- In H1FY25, the company delivered a 106% YoY increase in statutory profit after tax to AUD 87.6 million.
- INA targets EPS of 29.0–30.0 cents and EBIT growth of 20%–23% in FY25.
Ingenia Communities Group (ASX:INA) is a property developer that operates, owns and develops a portfolio of holiday and lifestyle across urban and coastal Australia communities with operations spanning five segments: Lifestyle Development, Lifestyle Rental, Ingenia Gardens, Ingenia Holidays, and Fuel, Food & Beverage Services.
In the first half of the financial year 2025 (H1FY25), the company’s revenue increased by 21% YoY to AUD 256.9 million, supported by a substantial rise in home settlements, higher average home sale prices, and increased holiday occupancy and rates. During the reported period, statutory profit after tax jumped 106% YoY to AUD 87.6 million.
Company Outlook
Ingenia Communities Group has upgraded its FY25 guidance, reflecting progress across its 1-, 3-, and 5-year strategic plans. Key drivers of the performance include increased joint venture settlements, cost reductions, and higher recurring revenue from operations and holiday parks.
The outlook is supported by 15 active development projects, along with stable residential demand and consistent holiday park performance. The company targets underlying EPS of 29.0 to 30.0 cents and EBIT growth of 20% to 23% in FY25, compared to FY24.
Travel & Tourism Outlook Strengthened by Visitor Growth
According to the data released by the Australian Bureau of Statistics in mid-July 2025, overseas arrivals surged by 12.2% year-on-year to 1,659,520, while overseas departures rose 7.7% to 1,679,750 in May 2025. Short-term visitor arrivals reached 611,180 in the same month, up 1.7% from May 2024. At the same time, short-term resident returns increased significantly by 20.1% to 970,060. These trends highlight rising mobility and bode well for sustained momentum in the country’s travel and tourism sector.
However, this positive outlook is not without risks. Geopolitical tensions—particularly diplomatic disputes with key countries such as China—can hinder inbound travel. Additionally, stricter visa rules and entry restrictions could dampen the growth trajectory of international tourism.
Share performance of INA
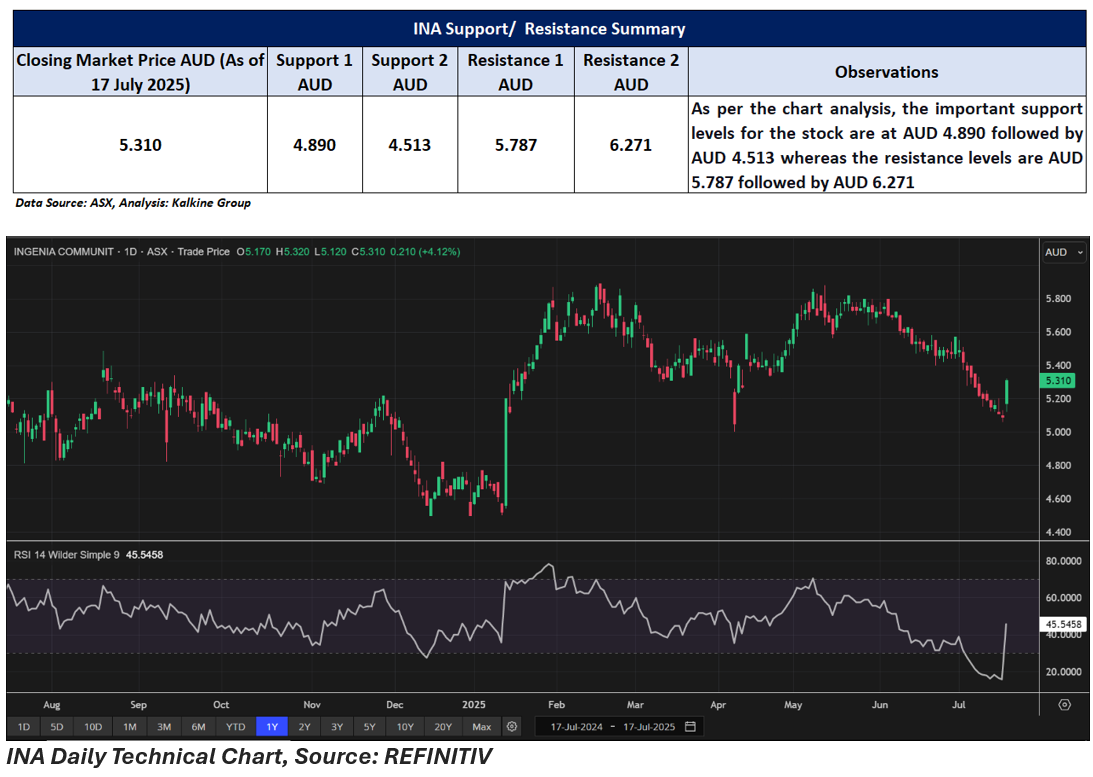
INA shares closed 4.12% higher at AUD 5.310 per share on 17 July 2025. Over the past year, the stock has gained 2.31%. However, it has seen some short-term volatility, with a 3.98% decline over the past month and a 2.21% fall in the past three months.
The 52-week high for INA stands at AUD 5.890, reached on 18 February 2025, while the 52-week low is AUD 4.500, hit on 13 January 2025.
Support and Resistance Summary
Note 1: Past performance is neither an Indicator nor a guarantee of future performance.
Note 2: The reference date for all price data, and currency, is 17 July 2025. The reference data in this report has been partly sourced from EODHD/Others.
Technical Indicators Defined:
Support: A level at which the stock prices tend to find support if they are falling, and a downtrend may take a pause backed by demand or buying interest. Support 1 refers to the nearby support level for the stock and if the price breaches the level, then Support 2 may act as the crucial support level for the stock.
Resistance: A level at which the stock prices tend to find resistance when they are rising, and an uptrend may take a pause due to profit booking or selling interest. Resistance 1 refers to the nearby resistance level for the stock and if the price surpasses the level, then Resistance 2 may act as the crucial resistance level for the stock.
Disclaimer
This article has been prepared by Kalkine Media, echoed on the website kalkinemedia.com/au and associated pages, based on the information obtained and collated from the subscription reports prepared by Kalkine Pty. Ltd. [ABN 34 154 808 312; AFSL no. 425376] on Kalkine.com.au (and associated pages). The principal purpose of the content is to provide factual information only for educational purposes. None of the content in this article, including any news, quotes, information, data, text, reports, ratings, opinions, images, photos, graphics, graphs, charts, animations, and video is or is intended to be, advisory in nature. The content does not contain or imply any recommendation or opinion intended to influence your financial decisions, including but not limited to, in respect of any particular security, transaction, or investment strategy, and must not be relied upon by you as such. The content is provided without any express or implied warranties of any kind. Kalkine Media, and its related bodies corporate, agents, and employees (Kalkine Group) cannot and do not warrant the accuracy, completeness, timeliness, merchantability, or fitness for a particular purpose of the content or the website, and to the extent permitted by law, Kalkine Group hereby disclaims any and all such express or implied warranties. Kalkine Group shall NOT be held liable for any investment or trading losses you may incur by using the information shared on our website.
