


Highlights
- GYG reported FY25 network sales of AUD 1,180.7 million, up 23% year-on-year.
- The company plans to open 32 new restaurants in FY26, including 23 drive-thru outlets.
- GYG launched a AUD 100 million on-market buyback, repurchasing 200,454 shares, as of 30 October 2025.
Guzman y Gomez Limited (ASX:GYG) is an Australian quick-service restaurant (QSR) company specialising in fresh, made-to-order Mexican-style food. Founded in Sydney in 2006, the brand has expanded to more than 250 restaurants across four countries.
Financial Update
For the year ended 30 June 2025 (FY25), the company has reported network sales of AUD 1,180.7 million, up 23% year-on-year (YoY) compared to the AUD 959.7 million in FY24. The company reported revenue of AUD 436 million in FY25, a 27.4% increase from AUD 342.2 million in FY24. In FY25 net profit after tax (NPAT) rose to AUD 14.5 million, a 151.8% increase from AUD 5.7 million in FY24.
Revenue and earnings growth was supported by higher comparable sales (9.6% in Australia), the opening of 39 new restaurants globally, improved operational efficiency, 23% global network sales expansion and better franchise performance, leading to a 45.5% increase in EBITDA on a pro forma basis.
Business Update
On 09 October 2025, GYG reported Q1FY26 network sales of AUD 330.6 million, an 18.6% increase, driven by comparable sales and the addition of five new restaurants. Operational improvements included digitised temperature monitoring and recipe standardisation, with 23 outlets operating 24/7 and new Caesar menu items introduced. The US division saw growth with one new store.
GYG also launched a AUD 100 million on-market buyback. As per 31 October 2025 update, the company repurchased 200,454 shares at prices between AUD 24.68 and AUD 27.00 by 30 October 2025.
Key Positives and Negatives
In Q1 FY26, the company’s network sales rose to AUD 330.6 million compare to AUD 278.8 million in Q1 FY25 and total restaurants increased to 261 compare to 226 in Q1 FY25. However, network sales growth slowed to 18.6% in Q1 FY26 from 20.7% Q1 FY25, and in the same duration debt-to-equity ratio rose to 0.87x from 0.68x in FY24.
Business Outlook
In FY26, GYG plans to open 32 new restaurants, including 23 drive-thru outlets, aiming to enhance network sales, long-term EBITDA growth and margins, with about 12 openings expected in Q2FY26. The Australia segment’s EBITDA margin is projected to rise to 5.9–6.3% in FY26, compared with 5.7% in FY25. Continued US network expansion and investment in operations, workforce, and digital systems are expected to support sales growth.
Share Performance of GYG
GYG’ shares were trading at AUD 25.39 per share on 03 November 2025 with intraday loss of 4.98%. GGP’s stock down by 7.77% in last three months as well as down by 19.77% over the six months, and down by 32.45% over the past year. GYG’s 52 week high is AUD 45.99, recorded on 19 February 2025 and 52-week low is AUD 22.00, recorded on 22 August 2025.
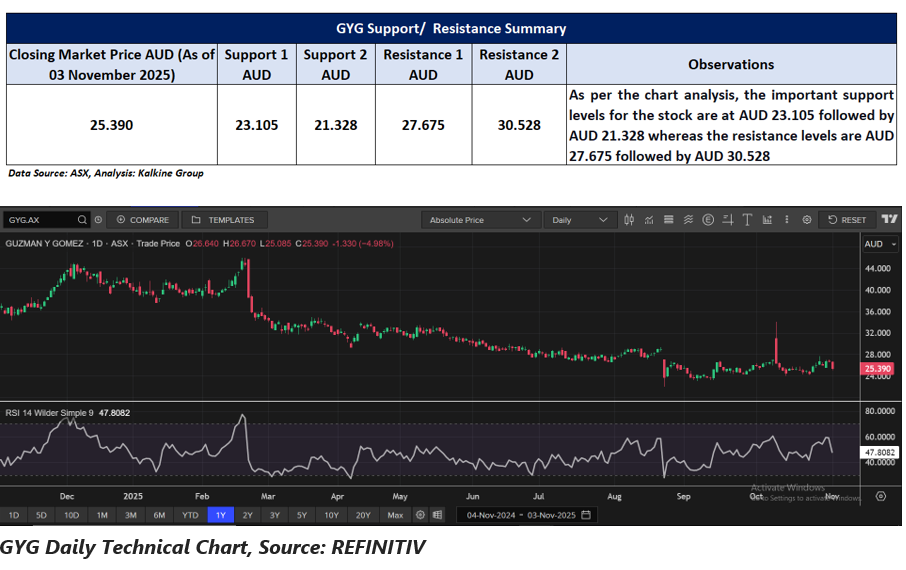
Support and Resistance Summary
Note 1: Past performance is neither an Indicator nor a guarantee of future performance.
Note 2: The reference date for all price data, and currency, is 03 November 2025. The reference data in this report has been partly sourced from EODHD/Others.
Technical Indicators Defined:
Support: A level at which the stock prices tend to find support if they are falling, and a downtrend may take a pause backed by demand or buying interest. Support 1 refers to the nearby support level for the stock and if the price breaches the level, then Support 2 may act as the crucial support level for the stock.
Resistance: A level at which the stock prices tend to find resistance when they are rising, and an uptrend may take a pause due to profit booking or selling interest. Resistance 1 refers to the nearby resistance level for the stock and if the price surpasses the level, then Resistance 2 may act as the crucial resistance level for the stock.
Disclaimer
This article has been prepared by Kalkine Media, echoed on the website kalkinemedia.com/au and associated pages, based on the information obtained and collated from the subscription reports prepared by Kalkine Pty. Ltd. [ABN 34 154 808 312; AFSL no. 425376] on Kalkine.com.au (and associated pages). The principal purpose of the content is to provide factual information only for educational purposes. None of the content in this article, including any news, quotes, information, data, text, reports, ratings, opinions, images, photos, graphics, graphs, charts, animations, and video is or is intended to be, advisory in nature. The content does not contain or imply any recommendation or opinion intended to influence your financial decisions, including but not limited to, in respect of any particular security, transaction, or investment strategy, and must not be relied upon by you as such. The content is provided without any express or implied warranties of any kind. Kalkine Media, and its related bodies corporate, agents, and employees (Kalkine Group) cannot and do not warrant the accuracy, completeness, timeliness, merchantability, or fitness for a particular purpose of the content or the website, and to the extent permitted by law, Kalkine Group hereby disclaims any and all such express or implied warranties. Kalkine Group shall NOT be held liable for any investment or trading losses you may incur by using the information shared on our website.
