


Highlights
- GQG’s FUM reached a new high of USD 160.5 billion as of February 2025, driven by robust net inflows.
- FY24 saw net income attributable to GQG shareholders rise by 46.91%, reaching USD 431.6 million.
- GQG has raised its dividend payout ratio to 50% - 95% of distributable earnings, offering increased flexibility and rewarding shareholders.
GQG Partners Inc. (ASX:GQG) is an international boutique asset management firm renowned for its active equity portfolios. In the financial year ended 31 December 2024, the company posted a 26.87% YoY increase in its closing Funds Under Management (FUM), reaching a total of USD 153 billion, up from USD 120.6 billion in FY23. During the reported period, net inflows reached USD 20.2 billion, nearly double those of the previous year’s net inflows of USD 10.2 billion.
Additionally, GQG saw a 52.78% YoY increase in net income attributable to shareholders, which reached USD 431.6 million in FY24, compared to USD 282.5 million in FY23. Meanwhile, net revenue jumped 46.91% YoY to USD 760.4 million.
In light of its recent financial performance, GQG has decided to increase its dividend payout ratio to 50% - 95% of distributable earnings.
Recent Business Developments
GQG’s financial momentum continues into 2025, with the company reaching a new milestone in February 2025. As of 28 February 2025, GQG’s FUM stood at USD 160.5 billion, marking a slight increase from USD 160.4 billion at the end of January 2025. Net flows for February alone were USD 1.1 billion, while total net flows for the year to date amounted to USD 2.8 billion.
Competitive Fee Structure
The company maintains a weighted average management fee of 49.6 basis points (bps), which is relatively low compared to peers. This competitive fee structure reduces the risk of margin pressure, particularly in a market where many asset managers face rising costs. Moreover, GQG derives over 96% of its revenues from asset-based fees, providing a stable revenue stream for the company.
Share performance of GQG
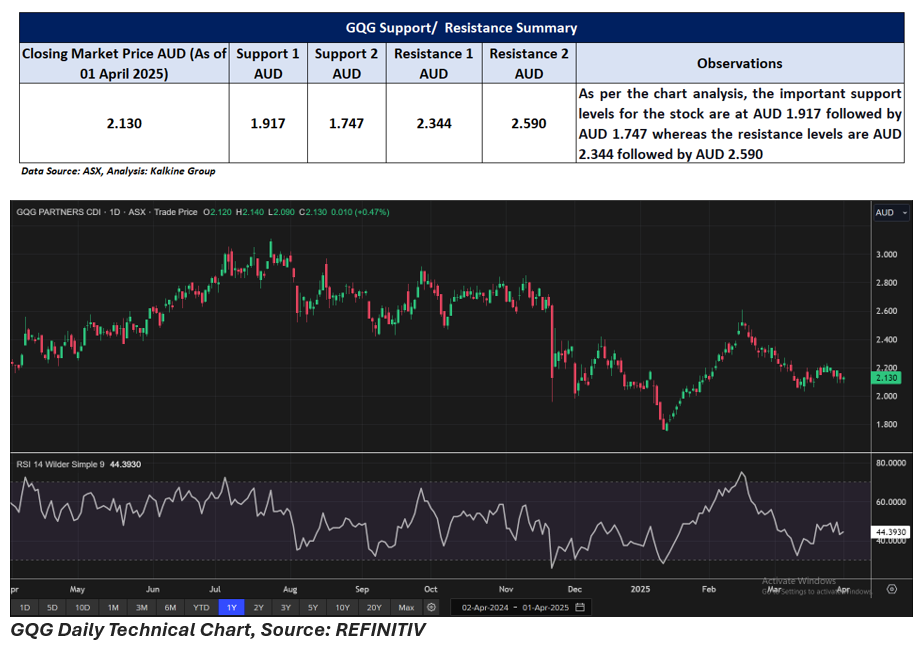
GQG shares closed 0.47% higher at AUD 2.13 per share on 1 April 2025. Over the past year, GQG’s share price has dropped by almost 4.91%, and in the past three months, it has increased by approximately 2.90%.
52-week high of GQG is AUD 3.11, recorded on 24 July 2024 and 52-week low is AUD 1.75, recorded on 14 January 2025.
Support and Resistance Summary
Note 1: Past performance is neither an Indicator nor a guarantee of future performance.
Note 2: The reference date for all price data, and currency, is 01 April 2025. The reference data in this report has been partly sourced from EODHD/Others.
Technical Indicators Defined:
Support: A level at which the stock prices tend to find support if they are falling, and a downtrend may take a pause backed by demand or buying interest. Support 1 refers to the nearby support level for the stock and if the price breaches the level, then Support 2 may act as the crucial support level for the stock.
Resistance: A level at which the stock prices tend to find resistance when they are rising, and an uptrend may take a pause due to profit booking or selling interest. Resistance 1 refers to the nearby resistance level for the stock and if the price surpasses the level, then Resistance 2 may act as the crucial resistance level for the stock.
Disclaimer
This article has been prepared by Kalkine Media, echoed on the website kalkinemedia.com/au and associated pages, based on the information obtained and collated from the subscription reports prepared by Kalkine Pty. Ltd. [ABN 34 154 808 312; AFSL no. 425376] on Kalkine.com.au (and associated pages). The principal purpose of the content is to provide factual information only for educational purposes. None of the content in this article, including any news, quotes, information, data, text, reports, ratings, opinions, images, photos, graphics, graphs, charts, animations, and video is or is intended to be, advisory in nature. The content does not contain or imply any recommendation or opinion intended to influence your financial decisions, including but not limited to, in respect of any particular security, transaction, or investment strategy, and must not be relied upon by you as such. The content is provided without any express or implied warranties of any kind. Kalkine Media, and its related bodies corporate, agents, and employees (Kalkine Group) cannot and do not warrant the accuracy, completeness, timeliness, merchantability, or fitness for a particular purpose of the content or the website, and to the extent permitted by law, Kalkine Group hereby disclaims any and all such express or implied warranties. Kalkine Group shall NOT be held liable for any investment or trading losses you may incur by using the information shared on our website.
