
_08_20_2025_11_17_39_359740.png)


Highlights
- GDI’s revenue increased by 20.3% YoY to AUD 39.1 million in 1HFY25.
- Net profit reached AUD 18.3 million during the period, compared to a net loss of AUD 7.3 million in 1HFY24.
- Over 16,000 sqm of lettable area leased, renewed, or signed since July 2024.
- The company has confirmed FY25 cash distribution of 5.0 cents per security.
GDI Property Group Limited (ASX:GDI) is an ASX-listed fully integrated and internally managed property and funds management group. In the half year ended 31 December 2024 (1HFY25), the company recorded total revenue of AUD 39.1 million, up 20.3% YoY from AUD 32.5 million in prior corresponding period. The company also swung to a net profit of AUD 18.3 million in 1HFY25, compared with a net loss of AUD 7.3 million in 1HFY24. During the reported period, cash holdings increased to AUD 15.1 million, up from AUD 8.9 million a year earlier. Funds From Operations (FFO) grew 26% YoY, supported by a 38% rise in Property FFO.
Net tangible assets (NTA) were maintained at AUD 1.19 per security, backed by valuation gains from Westralia Square and WS2.
Operational Highlights
Since 1 July 2024, GDI has leased, renewed, or signed Heads of Agreement for over 16,000 sqm of lettable area. In 1HFY25, the company also completed the sale of four assets in the Autoleague Portfolio (GDI No. 46 Property Trust), achieving premiums ranging from 2% to 23% above valuation.
On 6 June 2025, the company confirmed that the previously announced sale of 6 Sunray Drive, Innaloo had become unconditional. Upon final settlement, the Trust is expected to deliver an internal rate of return of approximately 9.0% p.a.
Outlook
According to the data released by the Australian Bureau of Statistics (ABS), in March 2025, the total value of residential dwellings increased by AUD 130.7 billion to AUD 11.37 trillion, alongside a rise of 53,400 dwellings to 11.34 million. In this environment, GDI is maintaining its focus on boosting leasing activity to enhance asset values across its Property Division and Funds Business, while also pursuing capital recycling and portfolio growth opportunities.
The company also reaffirmed its intention to pay a cash distribution of 5.0 cents per security for FY25, assuming no significant changes occur. Of this, a portion for the second half of FY25 is expected to be funded from capital, following the 2.5 cents per security distribution paid for the six months ended 31 December 2024.
Share performance of GDI
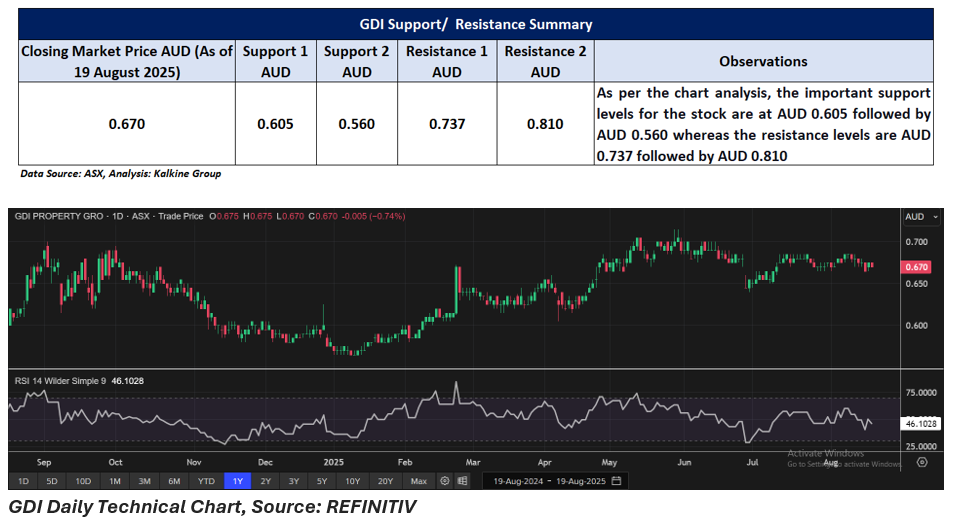
GDI shares declined 0.74% to close at AUD 0.670 per share on 19 August 2025, down from the previous close of AUD 0.675. Over the past year, GDI’s share price has gained 8.06%, while it remains up 16.52% year-to-date. However, shares have fallen 1.47% over the past week. The company offers a gross dividend yield of 7.41%.
The 52-week high for GDI was AUD 0.715, recorded on 29 May 2025, while the 52-week low was AUD 0.565, reached on 14 January 2025.
Support and Resistance Summary
Note 1: Past performance is neither an Indicator nor a guarantee of future performance.
Note 2: The reference date for all price data, and currency, is 19 August 2025. The reference data in this report has been partly sourced from EODHD/Others.
Technical Indicators Defined:
Support: A level at which the stock prices tend to find support if they are falling, and a downtrend may take a pause backed by demand or buying interest. Support 1 refers to the nearby support level for the stock and if the price breaches the level, then Support 2 may act as the crucial support level for the stock.
Resistance: A level at which the stock prices tend to find resistance when they are rising, and an uptrend may take a pause due to profit booking or selling interest. Resistance 1 refers to the nearby resistance level for the stock and if the price surpasses the level, then Resistance 2 may act as the crucial resistance level for the stock.
Disclaimer
This article has been prepared by Kalkine Media, echoed on the website kalkinemedia.com/au and associated pages, based on the information obtained and collated from the subscription reports prepared by Kalkine Pty. Ltd. [ABN 34 154 808 312; AFSL no. 425376] on Kalkine.com.au (and associated pages). The principal purpose of the content is to provide factual information only for educational purposes. None of the content in this article, including any news, quotes, information, data, text, reports, ratings, opinions, images, photos, graphics, graphs, charts, animations, and video is or is intended to be, advisory in nature. The content does not contain or imply any recommendation or opinion intended to influence your financial decisions, including but not limited to, in respect of any particular security, transaction, or investment strategy, and must not be relied upon by you as such. The content is provided without any express or implied warranties of any kind. Kalkine Media, and its related bodies corporate, agents, and employees (Kalkine Group) cannot and do not warrant the accuracy, completeness, timeliness, merchantability, or fitness for a particular purpose of the content or the website, and to the extent permitted by law, Kalkine Group hereby disclaims any and all such express or implied warranties. Kalkine Group shall NOT be held liable for any investment or trading losses you may incur by using the information shared on our website.
