


_06_25_2026_03_53_23_801064.jpg)

Highlights
- CYL reported a 67% YoY increase in H1FY25 revenue, with EBITDA surging 258% YoY.
- H1FY25 revenue growth was driven by a 28% YoY increase in gold sales and a 31% YoY increase in average realised gold price.
- The company targets 200,000 oz gold output by bringing three new mining areas online within 12-18 months.
Catalyst Metals Limited (ASX:CYL) is an Australia-based gold exploration and production company focused on developing and operating gold assets across two gold belts in Australia.
In the first half of the financial year 2025 (H1FY25), CYL's revenue increased by 67% year-on-year (YoY) to AUD 224.1 million, supported by a 28% annual increase in gold sales and a 31% increase in average realised gold prices. EBITDA rose by 258% YoY to AUD 88.4 million in H1FY25, while net profit grew by 12.51% YoY to AUD 46.3 million. Meanwhile, its all-in sustaining cost (AISC) declined by 14% YoY to AUD 2,383, compared to AUD 2,769 in H1FY24, supporting its profitability.
Business Update
Through an ASX-update dated 19 June 2025, CYL clarified that ongoing litigation involving Vango Mining and Dampier has no material impact on the company, as it pertains to events before its 2023 acquisition of Vango. The company considers Zuleika Gold’s 16 June 2025 announcement as non-material and likely timed for publicity ahead of a court hearing.
Furthermore, CYL confirmed on 19 June 2025 that it completed the acquisition of the Old Highway Gold Project from Sandfire Resources, with transaction terms unchanged from its 8 May 2025 announcement.
Company Outlook
CYL aims to lift total group gold output to 200,000 ounces by bringing three new mining areas online within 12–18 months, leveraging existing infrastructure, with a low capital spend of AUD 31 million. The company is pursuing self-funded growth by reinvesting Plutonic Main Underground cashflows into exploration and development across the Plutonic Belt and advancing the Henty and Bendigo assets.
Top 10 Shareholders of CYL
The top 10 shareholders of CYL collectively account for approximately 20.39% of the total equity, with Van Eck Associates Corporation and Invesco Advisers, Inc. holding the largest individual stakes at around 3.06% and 2.97%, respectively.
Share performance of CYL
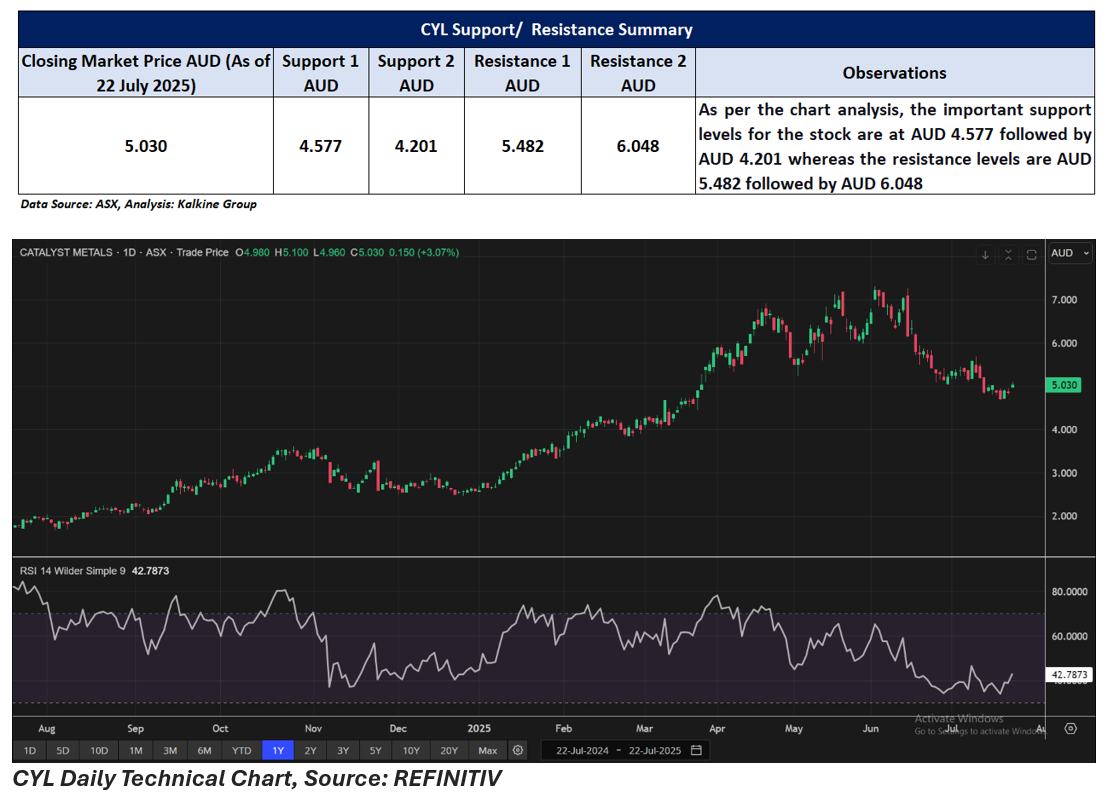
CYL shares closed 3.07% higher at AUD 5.030 per share on 22 July 2025. Over the past year, the stock has surged 182.58%, with gains of 42.09% in the past six months and 43.30% over nine months. However, the stock has declined 13.28% in the past one month and 24.70% over three months.
The 52-week high for CYL is AUD 7.300, recorded on 3 June 2025, while the 52-week low is AUD 1.675, recorded on 5 August 2024.
Support and Resistance Summary
Note 1: Past performance is neither an Indicator nor a guarantee of future performance.
Note 2: The reference date for all price data, and currency, is 22 July 2025. The reference data in this report has been partly sourced from EODHD/Others.
Technical Indicators Defined:
Support: A level at which the stock prices tend to find support if they are falling, and a downtrend may take a pause backed by demand or buying interest. Support 1 refers to the nearby support level for the stock and if the price breaches the level, then Support 2 may act as the crucial support level for the stock.
Resistance: A level at which the stock prices tend to find resistance when they are rising, and an uptrend may take a pause due to profit booking or selling interest. Resistance 1 refers to the nearby resistance level for the stock and if the price surpasses the level, then Resistance 2 may act as the crucial resistance level for the stock.
Disclaimer
This article has been prepared by Kalkine Media, echoed on the website kalkinemedia.com/au and associated pages, based on the information obtained and collated from the subscription reports prepared by Kalkine Pty. Ltd. [ABN 34 154 808 312; AFSL no. 425376] on Kalkine.com.au (and associated pages). The principal purpose of the content is to provide factual information only for educational purposes. None of the content in this article, including any news, quotes, information, data, text, reports, ratings, opinions, images, photos, graphics, graphs, charts, animations, and video is or is intended to be, advisory in nature. The content does not contain or imply any recommendation or opinion intended to influence your financial decisions, including but not limited to, in respect of any particular security, transaction, or investment strategy, and must not be relied upon by you as such. The content is provided without any express or implied warranties of any kind. Kalkine Media, and its related bodies corporate, agents, and employees (Kalkine Group) cannot and do not warrant the accuracy, completeness, timeliness, merchantability, or fitness for a particular purpose of the content or the website, and to the extent permitted by law, Kalkine Group hereby disclaims any and all such express or implied warranties. Kalkine Group shall NOT be held liable for any investment or trading losses you may incur by using the information shared on our website.
