


Highlights
- Bod Science Limited (ASX:BOD) shares were on a downtrend between December 2022 to March 2023.
- The stock lost almost two-thirds of its value during this time frame.
- Of late, the stock is witnessing some buying.
Bod Science Limited (ASX:BOD), a penny healthcare stock listed on the Australian Securities Exchange, is witnessing some buying, of late, after making a 52-week low of AUD 0.050 on 24 March 2023. On Tuesday, shares of this cannabis player rose nearly 8.5% to close at AUD 0.064.
On 28 April 2023, this cannabis-centric healthcare company published its activities report for the quarter ending 31 March 2023. The company, which is yet to turn profitable, said its net cash used in operating activities reduced by 10% to AUD 1,071k in the March quarter over the December quarter. Quarterly receipts from customers stood at AUD 813k, 66% higher than the receipts of December quarter.
During the quarter, its Phase II clinical trial for a unique CBD formulation for Australia's Pharmacy only Schedule 3 market reached major study milestone with 'Last patient, First visit' indicating completion of trial screening and randomisation. The company said it was the only advanced Pharmacy Only (Schedule 3) CBD product candidate for the Australian market. Meanwhile, the company also submitted the Aqua Phase Pharmacokinetic (PK) Study for ethics approval. Once the company receives approval, it will recruit the 12 participants required for the study.
Given these developments, BOD shares managed to witness some recovery in April after being in a downtrend between December 2022 to March 2023, during which the stock fell from its 52-week high levels of AUD 0.170 to a 52-week low of AUD 0.050, losing almost 70% of its value.
Let's study the price chart of BOD to get some idea about its near-term price movement.
BOD’s Technical Analysis:
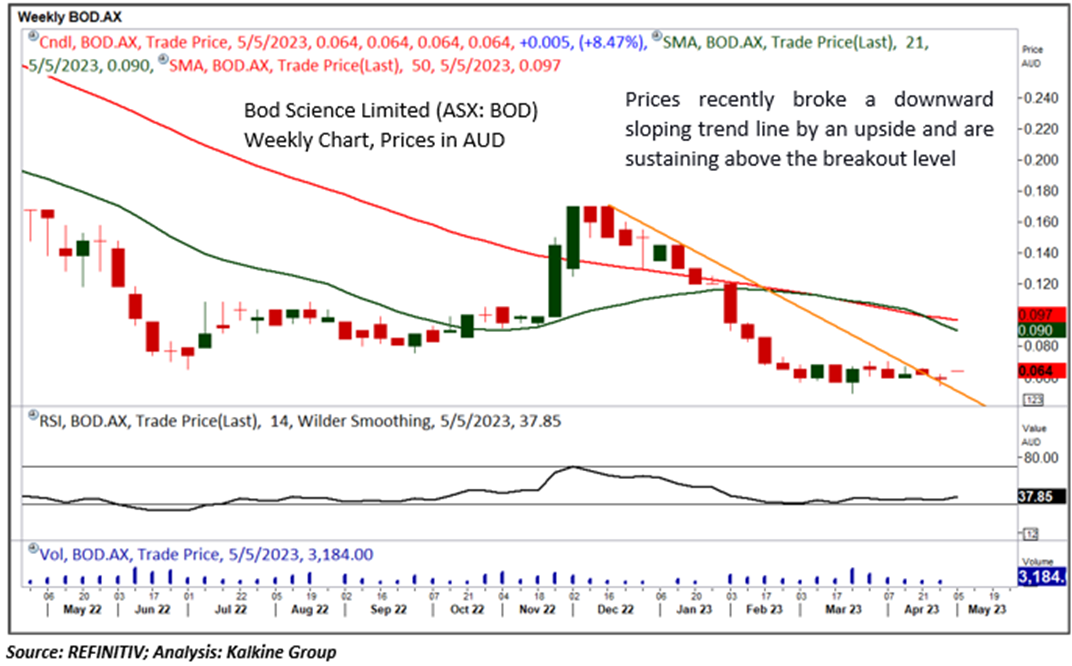
As seen from the below price chart of BOD, the stock recently broke a downward sloping trend line by an upside and is sustaining above the breakout level, indicating the possibility of an upside direction hereon. Moreover, the momentum oscillator RSI (14-period) started to move northward from the lower levels, showing a reading of 37.85. However, the 21-period and 50-period SMAs are above the current market prices (CMP) and may act as the dynamic resistance zones for the stock.
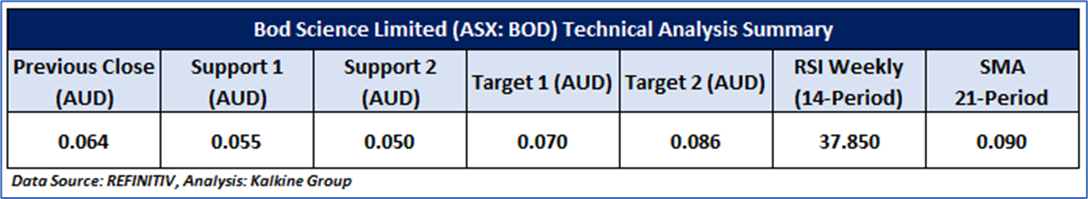
Weekly Technical Chart – BOD
The technical levels for the stock were evaluated as per the closing price of AUD 0.0640 per share as on 02 May 2023, up by ~8.5%.
Note 1: Past performance is neither an Indicator nor a guarantee of future performance.
Technical Indicators Defined:
Support: A level at which the stock prices tend to find support if they are falling, and a downtrend may take a pause backed by demand or buying interest. Support 1 refers to the nearby support level for the stock and if the price breaches the level, then Support 2 may act as the crucial support level for the stock.
Resistance: A level at which the stock prices tend to find resistance when they are rising, and an uptrend may take a pause due to profit booking or selling interest. Resistance 1 refers to the nearby resistance level for the stock and if the price surpasses the level, then Resistance 2 may act as the crucial resistance level for the stock.
Stop-loss: It is a level to protect further losses in case of unfavourable movement in the stock prices.
The Green colour line reflects the 21-period moving average. SMA helps to identify existing price trends. If the prices are trading above the 21-period, prices are currently in a bullish trend (Vice – Versa).
The Blue colour line reflects the 50-period moving average. SMA helps to identify existing price trends. If the prices are trading above the 50-period, prices are currently in a bullish trend (Vice – Versa).
The Orange/ Yellow colour line represents the Trendline.
The Purple colour line in the chart’s lower segment reflects the Relative Strength Index (14-Period), which indicates price momentum and signals momentum in trend. A reading of 70 or above suggests overbought status, while a reading of 30 or below suggests an oversold status.
Disclaimer
This article has been prepared by Kalkine Media, echoed on the website kalkinemedia.com/au and associated pages, based on the information obtained and collated from the subscription reports prepared by Kalkine Pty. Ltd. [ABN 34 154 808 312; AFSL no. 425376] on Kalkine.com.au (and associated pages). The principal purpose of the content is to provide factual information only for educational purposes. None of the content in this article, including any news, quotes, information, data, text, reports, ratings, opinions, images, photos, graphics, graphs, charts, animations, and video is or is intended to be, advisory in nature. The content does not contain or imply any recommendation or opinion intended to influence your financial decisions, including but not limited to, in respect of any particular security, transaction, or investment strategy, and must not be relied upon by you as such. The content is provided without any express or implied warranties of any kind. Kalkine Media, and its related bodies corporate, agents, and employees (Kalkine Group) cannot and do not warrant the accuracy, completeness, timeliness, merchantability, or fitness for a particular purpose of the content or the website, and to the extent permitted by law, Kalkine Group hereby disclaims any and all such express or implied warranties. Kalkine Group shall NOT be held liable for any investment or trading losses you may incur by using the information shared on our website.
