


Highlights
- In FY25, Austin Engineering reported group revenue of AUD 376.7 million, a 22% increase compared to FY24.
- The company repurchased 621,688 shares under its ongoing buy-back program, totalling AUD 185,347.96.
- For FY26, ANG projects revenue of AUD 390–410 million and plans continued rollout of austIQ condition monitoring and HPT systems.
Austin Engineering Limited (ASX:ANG) is an Australia-based global engineering firm specialising in the design and manufacture of loading and hauling equipment. The company produces off-highway dump truck bodies, buckets, water tanks, and various attachments that cater to both open-cut and underground mining operations.
Financial Update
In the financial year 2025 (FY25), ANG recorded group revenue of AUD 376.7 million, compared with AUD 308.3 million in FY24, recoding a 22% YoY change. Revenue growth was driven by improved APAC margins and North American expansion. Underlying EBITDA was AUD 55.8 million, up 30% in FY25 from AUD 43.0 million in FY24, Growth was supported by operation efficiencies and higher tray sales. During the same period statutory EBITDA decreased 4.2% YoY, reflecting Chilean start-up costs and higher working capital. Underlying profit before tax (PBT) was AUD 43.7 million in FY25, compared with AUD 30.5 million in FY24, a 43% YoY change.
Business Update
On 23 October 2025, ANG has reported the repurchase of 621,688 shares on 22 October 2025 at prices between AUD 0.295 and AUD 0.300, totaling AUD 185,347.96, under its ongoing buy-back program managed by Shaw and Partners. The program, approved on 25 September 2025, permits repurchasing up to 10% of ordinary shares over 12 months.
Key Positives and Negatives
In FY25, the company has recorded an EBITDA margin of 10.5% compared to the industry median of 9.6%. During the same period the net margin was 7.0%, against the industry median of 5.0%. The company reported a cash cycle of 108.1 days, compared to the industry median of 84.5 days in FY25 and in the same period the debt-to-equity ratio stood at 0.36x, compared with the industry median of 0.20x.
Business Outlook
For FY26, ANG projects revenue of AUD 390–410 million and underlying EBIT of AUD 40–46 million. Investments in North American and Indonesian facilities is anticipated to increase production capacity and improve delivery times. The company plans to continue rolling out austIQ condition monitoring and high-performance tray (HPT) systems to expand recurring revenue.
Focus on working capital management, procurement through AustBuy, and cost control is expected to support operating cashflows.
Share Performance
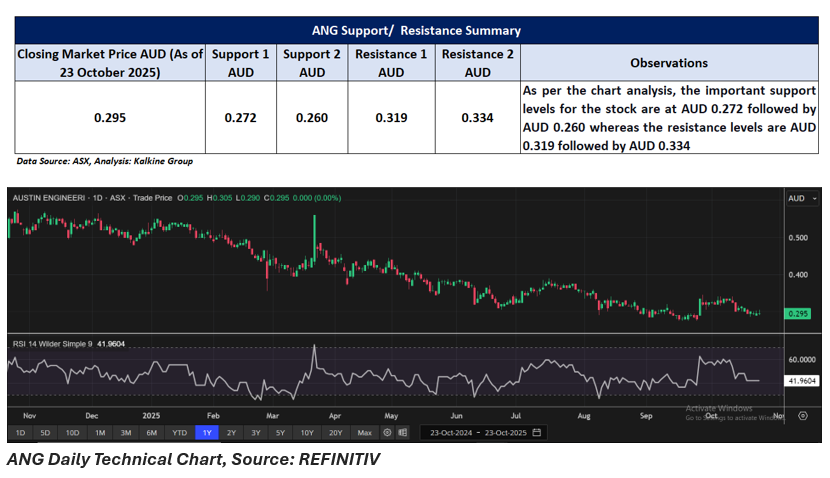
ANG’s shares traded at AUD 0.295 per share on 23 October 2025, down 19.17% over the past three months, 28.91% over the past six months, and 46.36% over the past year. The 52-week high of AUD 0.575, was recorded on 28 October 2024, and the 52-week low of AUD 0.275, was recorded on 24 September 2025.
Support and Resistance Summary
Note 1: Past performance is neither an Indicator nor a guarantee of future performance.
Note 2: The reference date for all price data, and currency, is 23 October 2025. The reference data in this report has been partly sourced from EODHD/Others.
Technical Indicators Defined:
Support: A level at which the stock prices tend to find support if they are falling, and a downtrend may take a pause backed by demand or buying interest. Support 1 refers to the nearby support level for the stock and if the price breaches the level, then Support 2 may act as the crucial support level for the stock.
Resistance: A level at which the stock prices tend to find resistance when they are rising, and an uptrend may take a pause due to profit booking or selling interest. Resistance 1 refers to the nearby resistance level for the stock and if the price surpasses the level, then Resistance 2 may act as the crucial resistance level for the stock.
Disclaimer
This article has been prepared by Kalkine Media, echoed on the website kalkinemedia.com/au and associated pages, based on the information obtained and collated from the subscription reports prepared by Kalkine Pty. Ltd. [ABN 34 154 808 312; AFSL no. 425376] on Kalkine.com.au (and associated pages). The principal purpose of the content is to provide factual information only for educational purposes. None of the content in this article, including any news, quotes, information, data, text, reports, ratings, opinions, images, photos, graphics, graphs, charts, animations, and video is or is intended to be, advisory in nature. The content does not contain or imply any recommendation or opinion intended to influence your financial decisions, including but not limited to, in respect of any particular security, transaction, or investment strategy, and must not be relied upon by you as such. The content is provided without any express or implied warranties of any kind. Kalkine Media, and its related bodies corporate, agents, and employees (Kalkine Group) cannot and do not warrant the accuracy, completeness, timeliness, merchantability, or fitness for a particular purpose of the content or the website, and to the extent permitted by law, Kalkine Group hereby disclaims any and all such express or implied warranties. Kalkine Group shall NOT be held liable for any investment or trading losses you may incur by using the information shared on our website.
