
_08_01_2025_07_14_54_774702.png)


Highlights
- ARX reported FY25 revenue of NZD 84.7 million, up 23% YoY, led by strong Myriad™ and OviTex™ sales and an 86% gross margin.
- ARX achieved positive net cash flow for the third consecutive quarter, ended FY25 debt-free, with NZD 22.2 million in cash.
- ARX expects FY26 revenue of NZD 92–100 million and normalised EBITDA of NZD 5–8 million.
Aroa Biosurgery Limited (ASX:ARX) is a soft-tissue regeneration company developing and distributing advanced wound care and surgical products based on its proprietary AROA ECM™ technology derived from sheep forestomach.
In the financial year ended 31 March 2025 (FY25), ARX reported a 23% YoY increase in total revenue to NZD 84.7 million, up from NZD 69.1 million in FY24, driven by higher sales of Myriad™ (up 38%) and OviTex™ (up 22%), with a higher margin product mix boosting gross margin to 86%. Normalised EBITDA turned positive in FY25, reaching NZD 4.2 million, compared to a loss of NZD 3.1 million in the prior year, supported by increased revenue, controlled operating expenses, and efficient investment in clinical development. Total loss narrowed significantly to NZD 3.8 million, compared to an NZD 10.6 million loss in FY24.
Business Update
In the June 2025 quarter, ARX achieved its third consecutive quarter of positive net cash flow, with NZD 1.7 million from operations and customer receipts of NZD 22.5 million. The company ended the period debt-free, holding NZD 22.2 million in cash.
ARX’s sales growth during the reported period was driven by high-margin Myriad™ product range and greater visibility through key industry events. Clinical progress included two new peer-reviewed studies, one highlighting Endoform™’s effectiveness in treating venous leg ulcers, while capital expenditure totalling NZD 0.9 million for routine operations.
Company Outlook
In FY26, ARX expects revenue between NZD 92–100 million, implying 10–20% YoY growth, driven by over 25% growth in Myriad™ sales and sustained sales productivity. TELABio sales are forecast to grow moderately alongside continued investment in sales capabilities.
Normalised EBITDA is projected at NZD 5–8 million in FY26, a 19–90% YoY increase, supported by disciplined clinical spend and product development. ARX also aims to capture opportunities in a USD 3 billion addressable market through its ECM technology and ongoing innovation.
Share performance of ARX
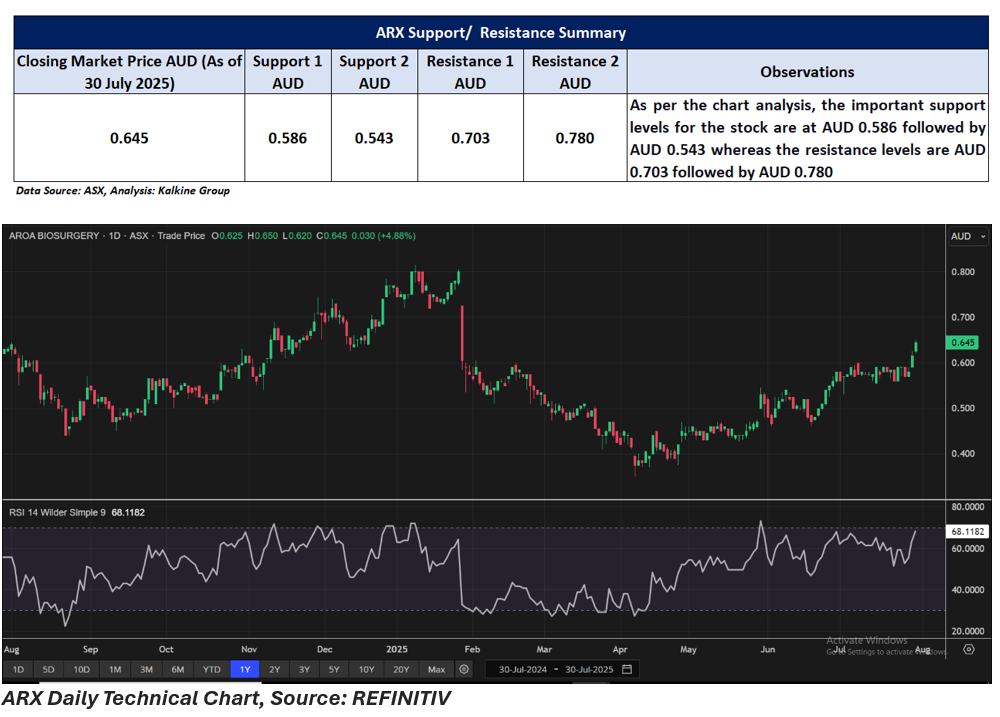
ARX shares closed 4.88% higher at AUD 0.645 per share on 30 July 2025. Over the past year, the stock has risen 2.38%, with strong recent gains of 46.59% over the past three months and 11.21% over the past month. The stock is up 6.61% over six months and 7.50% over nine months. However, year-to-date, the share price has declined by 16.23%.
The 52-week high for ARX is AUD 0.815, recorded on 9 January 2025, while the 52-week low is AUD 0.350, recorded on 7 April 2025.
Support and Resistance Summary
Note 1: Past performance is neither an Indicator nor a guarantee of future performance.
Note 2: The reference date for all price data, and currency, is 30 July 2025. The reference data in this report has been partly sourced from EODHD/Others.
Technical Indicators Defined:
Support: A level at which the stock prices tend to find support if they are falling, and a downtrend may take a pause backed by demand or buying interest. Support 1 refers to the nearby support level for the stock and if the price breaches the level, then Support 2 may act as the crucial support level for the stock.
Resistance: A level at which the stock prices tend to find resistance when they are rising, and an uptrend may take a pause due to profit booking or selling interest. Resistance 1 refers to the nearby resistance level for the stock and if the price surpasses the level, then Resistance 2 may act as the crucial resistance level for the stock.
Disclaimer
This article has been prepared by Kalkine Media, echoed on the website kalkinemedia.com/au and associated pages, based on the information obtained and collated from the subscription reports prepared by Kalkine Pty. Ltd. [ABN 34 154 808 312; AFSL no. 425376] on Kalkine.com.au (and associated pages). The principal purpose of the content is to provide factual information only for educational purposes. None of the content in this article, including any news, quotes, information, data, text, reports, ratings, opinions, images, photos, graphics, graphs, charts, animations, and video is or is intended to be, advisory in nature. The content does not contain or imply any recommendation or opinion intended to influence your financial decisions, including but not limited to, in respect of any particular security, transaction, or investment strategy, and must not be relied upon by you as such. The content is provided without any express or implied warranties of any kind. Kalkine Media, and its related bodies corporate, agents, and employees (Kalkine Group) cannot and do not warrant the accuracy, completeness, timeliness, merchantability, or fitness for a particular purpose of the content or the website, and to the extent permitted by law, Kalkine Group hereby disclaims any and all such express or implied warranties. Kalkine Group shall NOT be held liable for any investment or trading losses you may incur by using the information shared on our website.
