
_09_18_2025_03_52_48_430770.png)


Highlights
- AMA Group reported 8.6% revenue growth and 38.4% EBITDA growth in FY25, while narrowing net losses.
- The company is targeting a 10% EBITDA margin and projects AUD 70–75 million EBITDA in FY26, supported by increased repair volumes.
- While financial performance has strengthened, AMA faces elevated debt levels and ongoing margin pressures compared to industry peers.
AMA Group Limited (ASX:AMA) operates in the automotive aftercare market, providing vehicle accident repair services and accessories. Its operations are structured around two core divisions: vehicle panel repairs and automotive parts and accessories.
FY25 Financial Performance
For the 12 months ended 30 June 2025 (FY25), AMA reported revenue and other income of AUD 1,013.7 million, an 8.6% increase YoY compared to AUD 933.1 million in FY24. The growth was underpinned by targeted pricing strategies, expanded repair volumes, divisional growth, and successful integration of acquisitions and new services.
In FY25, normalised pre-AASB 16 EBITDA climbed 38.4% YoY to AUD 62.64 million, up from AUD 45.27 million in FY24. The company’s loss after income tax narrowed by 2.1% YoY, reducing to AUD 7.47 million from AUD 7.63 million in the prior year. AMA has confirmed that its 2025 Annual General Meeting (AGM) will be held at 10:00am (AEDT) on Monday, 3 November 2025.
Key Positives and Negatives
The group’s gross margin improved to 17.8% in FY25, compared to 16.2% in FY24, highlighting profitability. Additionally, its current ratio increased to 0.99x, up from 0.64x.
On the downside, AMA reported a negative net margin of -0.6%, well below the industry median of +4.1%, while its debt-to-equity ratio remained elevated at 1.72x, versus the industry median of 0.52x.
Outlook
Looking ahead, AMA is targeting a 10% EBITDA margin in its core collision repair business in the coming years. For FY26, the company projects normalised EBITDA between AUD 70 million and AUD 75 million, supported by its operational goal of completing 5,000 repairs per week.
Broader Market Context
Business turnover rose 2.9% in July 2025 (seasonally adjusted), marking the maximum monthly growth since May 2022, according to ABS data. Gains were widespread, with notable growth in Electricity, Gas, Water and Waste (15.8%), Professional Services (4.6%), Manufacturing (4.2%), and Construction (3.8%).
These trends highlight a continued momentum in the professional services sector.
Share performance of AMA
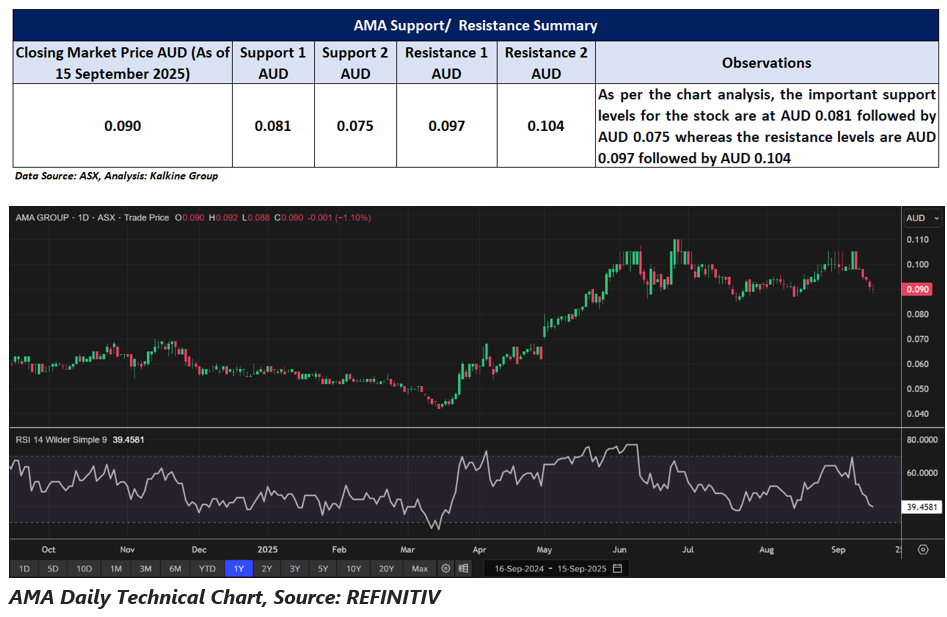
AMA shares closed at AUD 0.090 per share on 15 September 2025, slipping 1.10% intraday. Over the past year, AMA share has gained 47.54%. It has advanced 104.55% over six months and 57.89% over nine months. Year-to-date, the stock is up 60.71%. Month-to-date and quarter-to-date, the stock is down 10.00% and 14.29% respectively. The 52-week high of AUD 0.110 was recorded on 27 June 2025, while the 52-week low of AUD 0.042 occurred on 17 March 2025.
Support and Resistance Summary
Note 1: Past performance is neither an Indicator nor a guarantee of future performance.
Note 2: The reference date for all price data, and currency, is 15 September 2025. The reference data in this report has been partly sourced from EODHD/Others.
Technical Indicators Defined:
Support: A level at which the stock prices tend to find support if they are falling, and a downtrend may take a pause backed by demand or buying interest. Support 1 refers to the nearby support level for the stock and if the price breaches the level, then Support 2 may act as the crucial support level for the stock.
Resistance: A level at which the stock prices tend to find resistance when they are rising, and an uptrend may take a pause due to profit booking or selling interest. Resistance 1 refers to the nearby resistance level for the stock and if the price surpasses the level, then Resistance 2 may act as the crucial resistance level for the stock.
Disclaimer
This article has been prepared by Kalkine Media, echoed on the website kalkinemedia.com/au and associated pages, based on the information obtained and collated from the subscription reports prepared by Kalkine Pty. Ltd. [ABN 34 154 808 312; AFSL no. 425376] on Kalkine.com.au (and associated pages). The principal purpose of the content is to provide factual information only for educational purposes. None of the content in this article, including any news, quotes, information, data, text, reports, ratings, opinions, images, photos, graphics, graphs, charts, animations, and video is or is intended to be, advisory in nature. The content does not contain or imply any recommendation or opinion intended to influence your financial decisions, including but not limited to, in respect of any particular security, transaction, or investment strategy, and must not be relied upon by you as such. The content is provided without any express or implied warranties of any kind. Kalkine Media, and its related bodies corporate, agents, and employees (Kalkine Group) cannot and do not warrant the accuracy, completeness, timeliness, merchantability, or fitness for a particular purpose of the content or the website, and to the extent permitted by law, Kalkine Group hereby disclaims any and all such express or implied warranties. Kalkine Group shall NOT be held liable for any investment or trading losses you may incur by using the information shared on our website.
