


When stocks are evaluated for investment purposes, technical analysis is a key aspect being looked at along with stock fundamentals. In the previous article, we have discussed what the technical analysis, per se, means. In the current article, we will discuss the concept of moving averages and trendlines in detail.
Letâs start with the Trendlines
Whenever the prices move, they move in a wave (going up and down) and typically, never move in a straight line. These waves make the highest price point (from where the prices turn down) and lowest price point (from where the prices turn up). These high and low price points are termed as Peaks and Troughs, respectively.
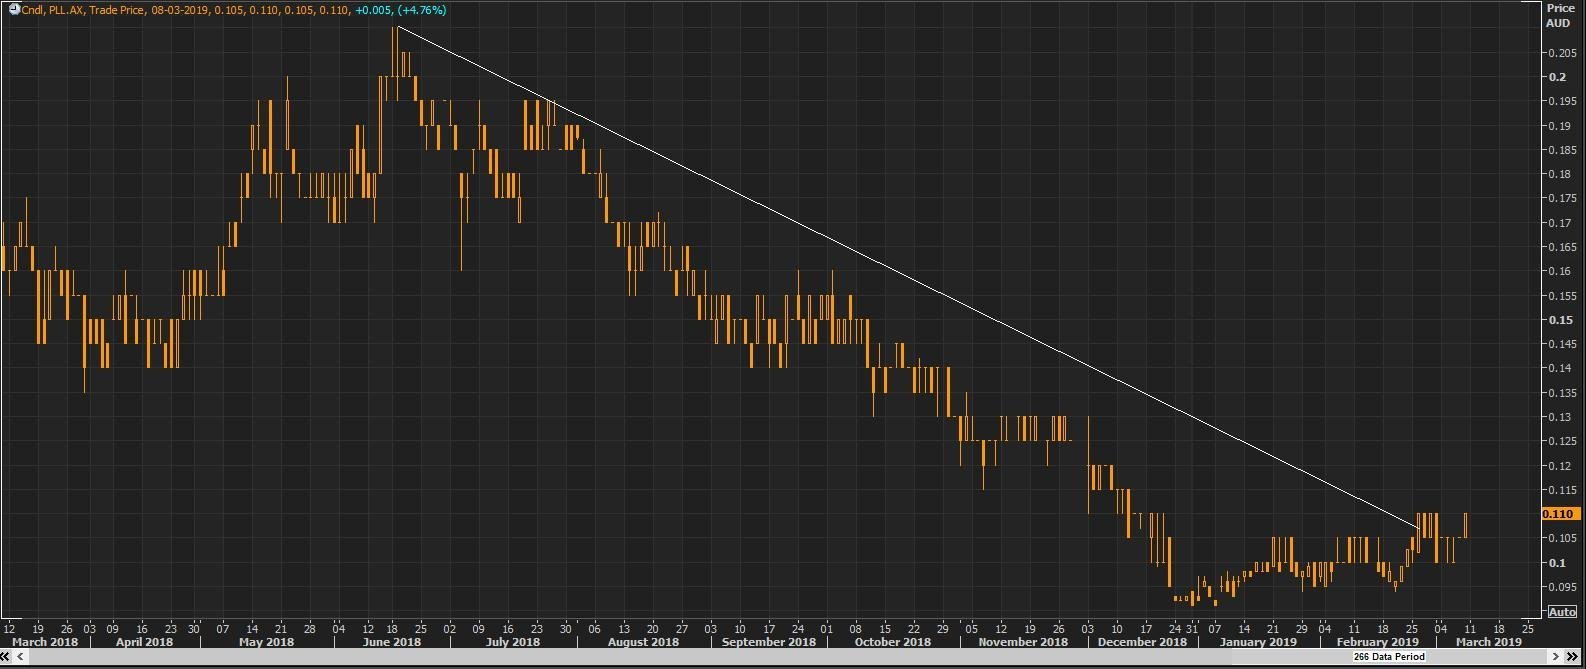
Now Trendline is simply a line drawn on the price chart by connecting two or more consecutive peaks or troughs. In other words, if the prices are falling then one trendline may be drawn connecting any two consecutive peaks. This line will always be falling as in a downtrend the succeeding peak must be lower than the preceding peak, hence creating a falling trendline. As seen in the price chart below.
Same goes for the rising trendline which is always made in a rising market or stock by connecting two consecutive troughs. The succeeding tough will always be higher than the preceding trough in a rising market, hence creating a rising trendline.
Now, what is the relevance of the trendline and how it is used in the technical analysis?
These trendlines help to determine the current trend of security by acting as a diagonal support and resistance level for the stock. Whenever the stock is falling in sync with its falling trendline (the price stays below the trendline), then the trend is termed to be negative and is not considered positive until the price breaks above the falling trendline (the price crosses the trendline to the upside). This is because an increase in selling is expected when the price goes towards the trendline as falling trendline also acts as a diagonal resistance level.
Whenever the stock is rising in sync with its rising trendline (the price stays above the trendline), then the trend is termed to be positive and is not considered negative until the price breaks below the rising trendline (the price crosses the trendline towards downside). This is because an increase in buying is expected when the price in in sync with the trendline as rising trendline also acts as a diagonal support level.
Finally, whenever the price breaches the trendline, the trend is deemed to have been changed in the direction of the breach.
Moving Averages
Moving average is a very popular technical indicator which is used widely all over the world. It is simply the average of the past prices which helps to smooth out the price fluctuation, also known as noise. In other words, it becomes difficult to analyse any stock in a highly volatile period, but the moving average provides a mean of those prices to better help with the analysis.
Moving averages is a trend following indicator which helps to follow the trend till its top or bottom. Due to this behaviour, the investor gets a buy and sell signal only after the trend has been established, which makes the entry less risky and one is able to ride the whole trend without exiting early.
But it also has some of the drawbacks, due to the trend following nature the moving average gives a late entry and exit signal. The prices have to move for quite some time to establish the trend for entry which is not preferred by some investors as some strategic decisions already are being missed out.
How to use moving average in trading or investing
When the security's price crosses above its moving average, then technically, it is a buy signal as per the moving average, and the trader can go long in stock and keep on holding it till the price goes back below the moving average. The longer the trend continues, the higher the moving average will go from the buying signal, helping the trader to trail up the exit price which tries to lock maximum profit potential. Same rules are applied in a downtrend movement. The short position can be taken when the price crosses below the moving average.
There are many types of moving averages, and we will discuss some of the most popular ones.
Simple moving average (SMA): A simple moving average (SMA) is simply calculated by taking the mean of the most recent closing prices. The number of days for which the mean needs to be calculated is totally dependent on the investor. The general thumb rule is higher the time frame for investment, higher the number of days that needs to be taken to calculate the mean price and vice versa.
Exponential moving average (EMA): An exponential moving average (EMA) is a slight variation of the SMA in the sense that it places a greater weightage and significance on the most recent prices. Therefore, sometimes EMA is also referred to as an exponentially weighted moving average. Due to a higher weightage on the recent prices, the EMA is able to react much faster to the prices than SMA in which the weightage is distributed equally to all prices.
Triangular moving average (TMA): The triangular moving average (TMA) is essentially a double smoothed moving average. In simple words, it is the average of another average of prices. It takes out the noise of the highest level but also one of the slowest averages to react to the prices.
Variable moving average (VMA): One of the drawbacks of the moving averages is that all of them are fixated to their sensitivity with respect to the prices. But the Variable moving average is uniquely developed and is able to regulate its smoothing percentage to dynamically react to the prices. In other words, VMA is able to change its reaction time based on the change in volatility.
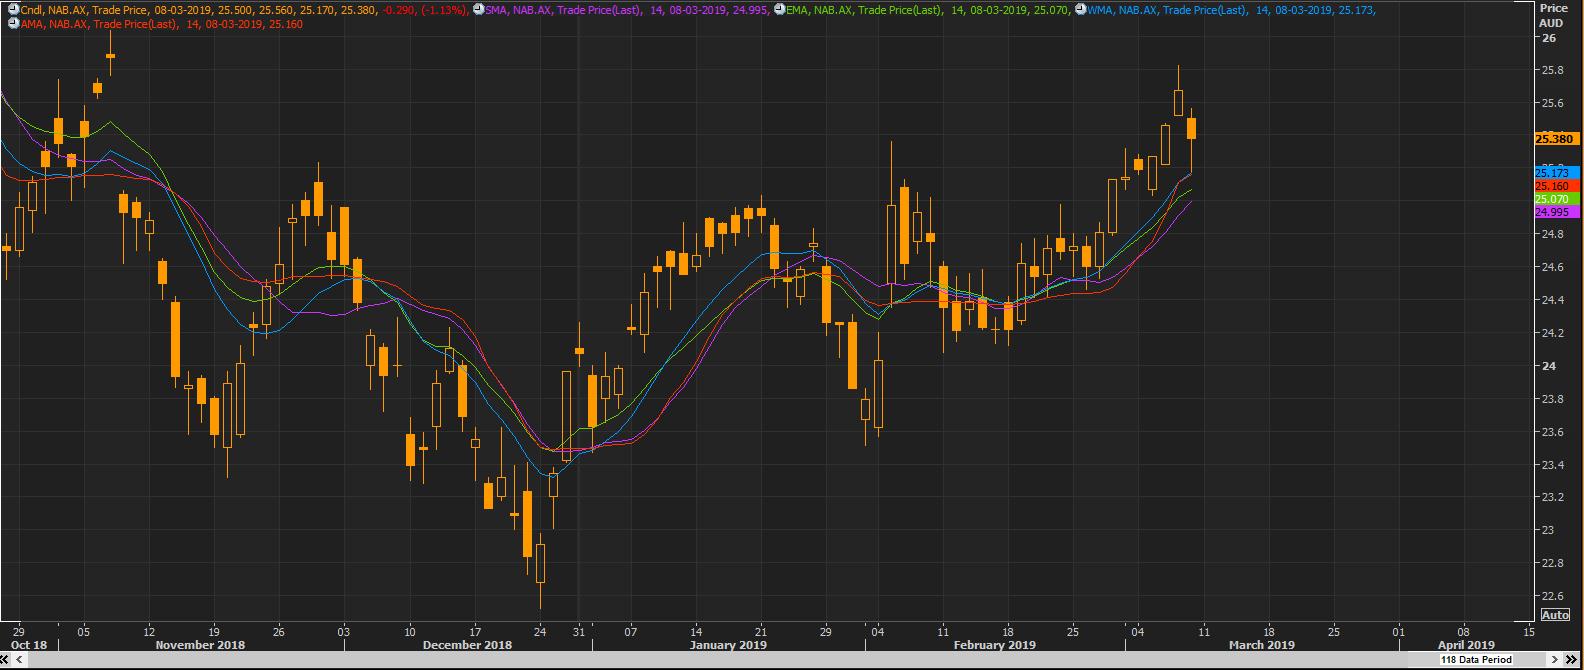
Here is a glimpse of above-mentioned moving averages on the price chart of National Australia Bank Ltd (ASX:NAB), plotted simultaneously so that the variations between them could be seen. For example, simple moving average is depicted through purple line and exponential moving average is depicted through green.
 There are many more moving averages, and all of them have their pros and cons. The selection of the type of moving average depends upon the market condition, the time frame of trading, entry-exit criteria etc.
Disclaimer
This website is a service of Kalkine Media Pty. Ltd. A.C.N. 629 651 672. The website has been prepared for informational purposes only and is not intended to be used as a complete source of information on any particular company. Kalkine Media does not in any way endorse or recommend individuals, products or services that may be discussed on this site. Our publications are NOT a solicitation or recommendation to buy, sell or hold. We are neither licensed nor qualified to provide investment advice.
