


In the financial markets, to trade (buy or sell) any underlying asset like stocks, bonds, commodities etc. a specific approach is needed for the analysis of the security. There are broadly two types of methods for the analysis of the security:
- Technical Analysis
- Fundamental Analysis
Fundamental analysis is concerned with the analysis of the underlying business of the company as a whole which includes study of internal aspects (financial statements like balance sheet, cash flow statement etc.) and other external aspects which have the tendency to affect the business in direct or indirect way like government policies, economic situation of the country, monetary policy of the central bank etc. After a thorough analysis, some conclusion is made whether the stock price of the company is undervalued or overvalued and consequently a buy or sell decision can be achieved at.
Technical analysis, on the other hand, is an entirely different approach to analyze the underlying asset. All the principles and methods of technical analysis have been derived from the observations of financial markets over hundreds of years. The oldest known use of technical analysis was by the Japanese rice traders in as early as 18th century. Unlike the fundamental analysis, the only data that is to be typically studied while doing technical analysis is the price of the security and the volume of shares traded in a particular time period. All the other aspects of technical analysis are more or less the derivatives of the price or volume per se.
Technical analysis works on the premise that the behavior of all the market participants collectively repeats the behavior of the participants that preceded them. Since this collective behavior repeats itself, a predictable and recognizable price pattern tends to develop on the price chart. It is this price pattern that needs to be identified in order to make any decision on the future price movement. For example, if any company's stock had fallen to a level of $100 in any given period and after failing to drop below $100, the stock rises sharply to $130; then in future, if the stock again falls to $100 and fails to go below that then it has a high probability of going back again to $130 based on the similar previous pattern.
In technical analysis, the study of price and volume is not done in a tabular or statistical form. This data is plotted on a chart also known as a price chart. Therefore it is a form of a pictorial representation of price and volume which makes the analysis of data much easier and convenient than just reading numbers in a statistical or tabular form. Apart from this, there are many indicators which are used in conjunction with price and volume to come to more precise and accurate analysis. For example, one of the most popular indicators used by the analysts is moving average which is nothing but the average of all the prices in a particular time period. It helps in smoothing the price variation and gives much stable mean price which can be used for various forms of analysis.
To summarize it all, technical analysis is referred to as an approach of evaluating the historical price data along with its volume, primarily using charts and other technical indicators in order to forecast the future price movement. Given this backdrop, lets have a look at National Australia Bank Ltd (ASX:NAB).
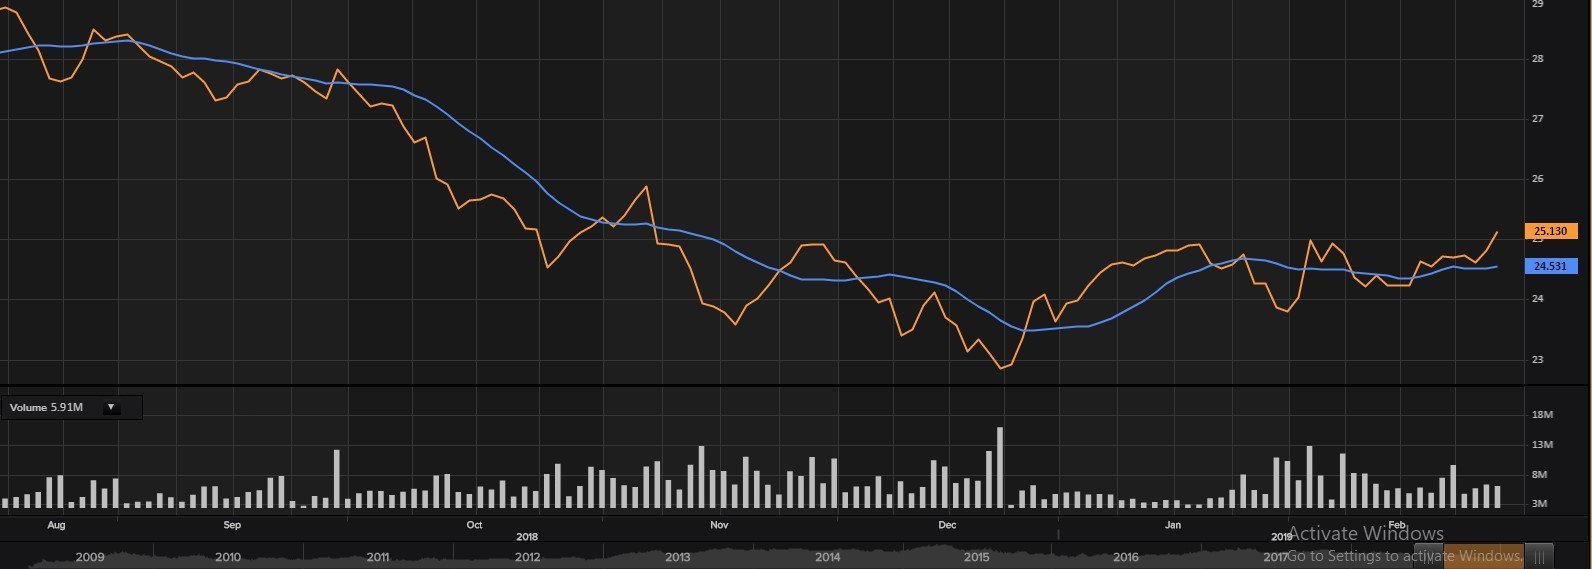 As seen in the price chart of NAB above, prices are provided on the right, volume at the bottom and time period below it. The yellow line represents the daily prices with closing price of the security for the day, and the blue line represents the average of the closing price for the past 14 trading sessions. This is one of the simplest and basic form of Technical analysis. When the price on yellow line is below its 14 days moving average (blue line) the trend is considered to be negative. Whenever the price (yellow line) crosses above its 14 days moving average (blue line) the trend is considered to be positive as in this case where the moving average is at A$24.53 and the actual price is trading above it at A$25.13, as at February 28, 2019.
Till now the trend seems to be positive with respect to the above mentioned explanation. But if broader picture is looked upon, one may notice that from the past 3-4 months the price was only hovering around the moving average by going slightly up and down. And the price was not able to cross A$25 mark in that period, stating investors were not willing to buy above A$25. This gives more refined analysis concluding âthe trend is positive (as the price is trading above the moving average) but may turn negative from A$25 markâ.
However on the last trading day, as clearly seen, after a few months the price was finally able to go above A$25, stating the demand is coming in even after surpassing the A$25 mark. This willingness to buy, combined with the already positive trend (as price is trading above its moving average) has turned the trend on the bullish side till it goes back below its moving average.
As of now, this banking sector stock (discussed more from dividend sustainability point of view) looks on a resilient side given the technical scenario.
Disclaimer
This website is a service of Kalkine Media Pty. Ltd. A.C.N. 629 651 672. The website has been prepared for informational purposes only and is not intended to be used as a complete source of information on any particular company. Kalkine Media does not in any way endorse or recommend individuals, products or services that may be discussed on this site. Our publications are NOT a solicitation or recommendation to buy, sell or hold. We are neither licensed nor qualified to provide investment advice.
