The S&P 500 Index tracks the top 500 companies in the U.S. stock market. These 500 companies account for roughly 80 percent of the total value of stocks in the U.S.
Unlike the Dow Jones Industrial Average, S&P 500 is a market capitalization-weighted index.
Investors always have an eye on this index to understand trends in large-cap companies on the stock market. The S&P 500’s total market capitalization is around US$37.99 trillion, and it is up 12.76 percent year to date.
Here, we explore the top ten stocks on the S&P 500 Index.
Apple Inc. (NASDAQ:AAPL)
The technology giant is popular for its iPhone smartphones line, which generates almost half of the company’s sales, and for its personal computers, tablets, and smartwatches.
Apple’s US$2.12 trillion market capitalization makes it the largest technology giant. The stock is down around 5 percent this year but returned approximately 44 in the last one-year period.
The company reported net sales of US$274.52 billion and net income of US$51.41 billion in fiscal 2020 ended September 26, 2020.
READ MORE: Apple net profits double in Q2
Microsoft Corporation (NASDAQ:MSFT)
Microsoft primarily develops operating systems and applications for computers. It has US$1.94 trillion in market capitalization. The stock gained over 15 percent year to date and 33 percent in one year. The shares traded in a range of US$184.01 to US$263.19 during the 52-week period.
The Washington-based technology company had a revenue of US$41.7 billion in the fiscal third quarter ended March. Net income totaled US$15.5 billion.
Microsoft, which owns Azure cloud computing service, recently bought cloud and AI-based healthcare software provider Nuance Communications, Inc. (NASDAQ:NUAN).
READ MORE: Nuance Stock Rallies on Microsoft’s US$19.7B deal
Amazon.com Inc. (NASDAQ:AMZN)
The Seattle-based company is an e-commerce giant and a heavyweight in cloud services through its AWS. The company recently announced a deal to buy MGM Studio to boost its OTT streaming service Prime Video content.
Amazon has a market capitalization of US$1.69 trillion. Its share price increased over 2 percent this year. It rose approximately 28 percent in the last one year. The stock traded in the range of US$2,503.35 to US$3,554.00 in the 52-week period.
In 2020, Amazon reported net sales of US$386.1billion and net income of US$21.3 billion.
READ MORE: Amazon Announces US$8.45B Deal To Buy MGM

Source: Pixabay.
Alphabet Inc. (NASDAQ: GOOGL, GOOG)
Google, which owns the Android operating system and YouTube, is a subsidiary of Alphabet. The California-based company also owns fitness brand Fitbit and autonomous driving technology company Waymo.
Alphabet has a market value of US$1.65 trillion. Its stock rose 38 percent this year and 69 percent in the one-year period. The shares’ 52-week high and low was US$1,351.65 and US$2,441.72, respectively.
Alphabet total revenue in 2020 came in at US$182.53 billion while net income totaled US$40.26 billion.
READ MORE: Alphabet Shares Up 4.5% In Extended Trading On Strong Q1 Revenue Growth
Facebook Inc. (NASDAQ:FB)
Apart from its Facebook social networking service, the technology conglomerate also owns Instagram, WhatsApp and GIPHY.
Facebook has a market capitalization of US$936.58 billion. Its stock returned 21 percent year to date and 45 percent in one year. The share price was between US$207.11 and US$338.30 in the 52-week period.
Advertisements are the source of revenue for the company. In 2020, Facebook’s revenue was US$85.96 billion. Net income totaled US$29.15 billion.
READ MORE: Robust ad revenue powers Facebook to 48% topline growth
Berkshire Hathaway
This Nebraska-based holding company has investments in a number of companies, including Apple Inc., Aon plc (NYSE:AON), Bank of America (NYSE:BAC), General Motors Company (NYSE:GM), Merck & Co. Inc. (NYSE:MRK), Verizon Communications Inc. (NYSE:VZ) and Kroger Co (NYSE:KR).
The market capitalization of Berkshire Hathaway, which has Warren Buffet as its chairman and CEO, stands at US$655.133 billion. Its stocks gained 23 percent this year and 54 percent in one year. The shares were trading between US$174.63 and US$295.08 in 52 weeks.
The multinational conglomerate generated US$245.51 revenue in 2020. Its net earnings during the year were US$43.25 billion.
READ MORE: Warren Buffett Buys Shares in Aon; Cuts Stake in Wells Fargo, Chevron
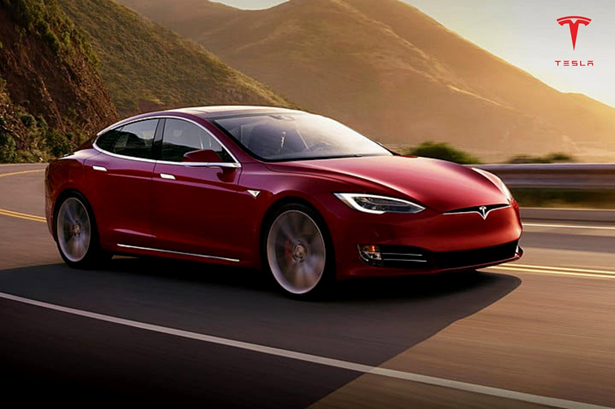
Tesla Inc. (NASDAQ:TSLA)
The California-based electric vehicle maker also develops solar panels and battery storage systems. Tesla produces vehicles from its facilities in the U.S. and Shanghai. It delivered 499,550 electric vehicles in 2020.
Tesla, which has a market value of US$587.75 billion, saw its share price rally 208 percent in one year. The stock is down around 15 percent year to date and has a 52-week trading range of US$181.70 to US$900.40.
Tesla’s total revenue in 2020 was US$31.54 billion, and net income totaled US$721 million.
READ MORE: Tesla Shares Drop Despite Record Earnings For Q1’21

Source: Pixabay
Visa Inc. (NYSE:V)
This fintech company facilitates digital payments. Visa has a market capitalization of US$515.33 billion.
Visa returned approximately 20 percent in the last one year and around 6 percent year to date. Its share shares traded between US$179.23 and US$237.50 during the 52-week period.
In fiscal 2020 ended September 30, the California-based company posted US$21.8 billion in revenue and US$10.9 net income. Visa processed US$140.8 billion transactions during the year.
READ MORE: Mastercard Outshines Visa In Revenue Growth Despite Similar Challenges
JPMorgan Chase & Co. (NYSE:JPM)
JP Morgan’s business includes investment banking, commercial banking, financial services and asset management. It has assets worth US$3.7 trillion.
The New York-based bank’s market capitalization totals US$484.39 billion. Its stock gained 60 percent in one year and is up almost 26 percent year to date. The shares have a 52-week trading range of US$90.78 to US$167.44.
JP Morgan made US$119.54 billion in revenue last year. Its net income totaled US$29.13 billion.
READ MORE: JP Morgan, Goldman Sachs, Wells Fargo Report Strong Q1’21 Earnings
Johnson & Johnson (NYSE:JNJ)
This pharmaceutical giant developed the first single-shot COVID-19 vaccine. The company also makes medical devices and consumer health products.
It has a market capitalization of US$433.80 billion. The stock grew 12 percent in one year and gained 6 percent year to date. The stock traded in the range of US$133.65 to 173.65 in the 52-week period.
In 2020, Johnson & Johnson reported sales of US$82.58 billion and earned US$14.71 billion.

.jpg)


