


Coal prices are under doldrums with Newcastle coal futures slipping from its 2018 peak price of USD 111.00 a tonne (high in October 2018) to the current level of USD 70.20 a tonne (low on 10 December 2019), which underpins a price depreciation of approx. 37 per cent.
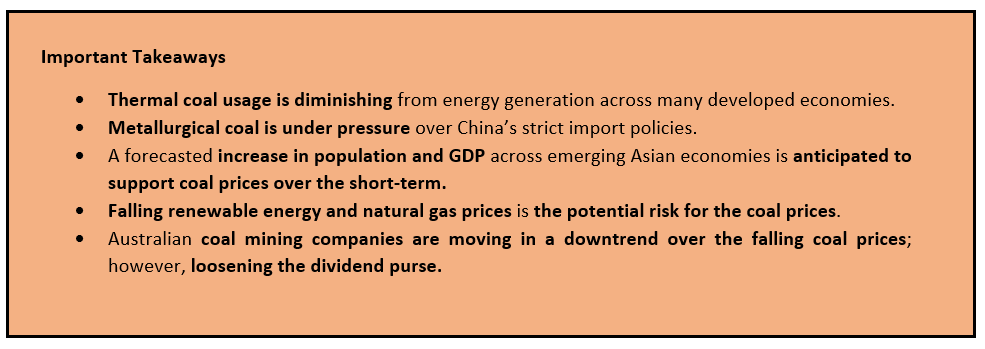
Coal is slowly waning from the energy generation portfolio with many coal-fired power plants approaching retirement across Australia and other geographical regions, and Accord de Paris is prompting many countries such as the United States, China, and Europe to shift the energy generation portfolio towards the renewable alternatives.
To Know More, Do Read: The Future of Energy Generation in Australia; Solar to Increase Three-Fold By 2024
Japan, which was favouring coal-fired generation till now is also shifting towards nuclear energy generation over the improved efficiency and safety of the nuclear power plants.
To Know More, Do read: ASX-Listed Alternative Energy Stocks Under Investorsâ Lens as Oil Risk Surmounts
Currently the demand for coal is fragmented along emerging and developed economies, while the demand for thermal coal is under pressure over the reduced usage in the developed nations, the emerging economies such as India is anticipated to use coal for the energy generation as the energy demand grows in account of increasing population and GDP.
To Know More, Do Read: EIA Modelled Reference Case Forecast; Non-OECD Nations To Witness Higher Energy Consumption
The fall in demand for coal across many geographies has prompted the ASX coal mining companies to loosen the dividend purse and divert the coal to the emerging Asia, where the demand for thermal coal is relatively high.
Suggested Read: Need Dividend from Mining Stocks? Coal Miners Well Positioned to meet your Dividend needs
While the thermal coal prices have witnessed a decline over the dwindling demand, the metallurgical coal also remained unimmune to the change in geopolitical trends. China, which continued to be the primary market for the domestic coal export, implemented strict import measures on coal to subsidise the domestic coal supply.
The trade protection measures implemented by China exerted the pressure on metallurgical coal prices as well.
Short-Term and Long-Term Trend
Over the short-term, the market participants anticipate the coal demand to remain in place across the emerging Asian economies before Asia could adopt technologies to switch from coal-to-gas and renewable sources.
DIIS Coal Price Forecast: Australia Diverting Coal To Emerging Asia While Chinaâs Coal Import Policies Cracking Down on ASX Coal Stocks
However, over the long-run coal is eventually estimated to face competition from the low natural gas prices, over the supply glut majorly created by the United States, Qatar, and Australia.
Suggested Read: Australia To Jostle Qatar for the LNG Crown; How Long Would the Reign Last?
Apart from that, the advancement across the technologies to make renewable energy more cost-friendly coupled with the Accord de Paris would eventually force a closure upon the coal usage over the long-run.
Trend and Projections of Coal Mining Companies
Whitehaven Coal Limited (ASX: WHC)
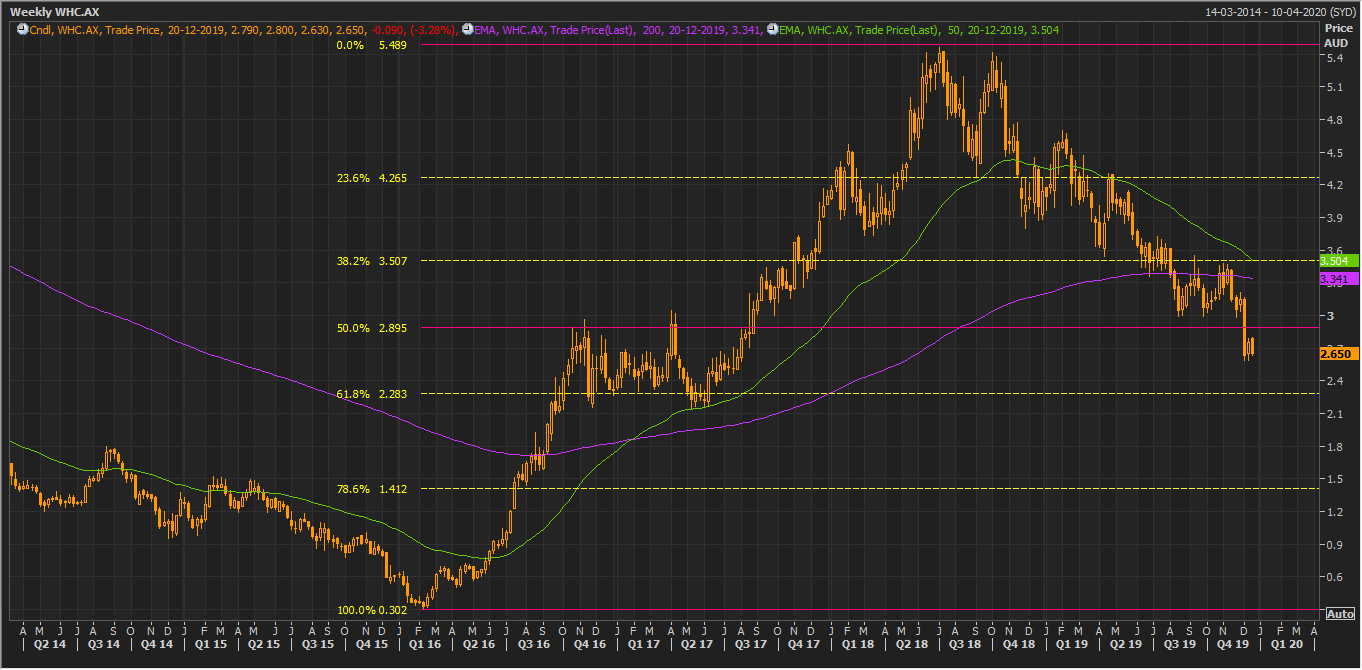
WHC Weekly Chart (Source: Thomson Reuters)
On the weekly chart, WHC is retracing back after a massive rally from approx. $0.302 (first quarter 2016) to the level of $5.489 (end of second quarter 2018). The top was marked by a bearish engulfing pattern. Post which, the stock has retracted over 50.0 per cent of the primary rally and is trading below the 50- and 200-days exponential moving averages, which could provide some resistance to the share prices.
If the prices close below the 61.8 per cent retracement level for one or more weeks, it could further bring the short-term moving average (50-day) down below the long-term moving average (200-day) to establish a negative trend.
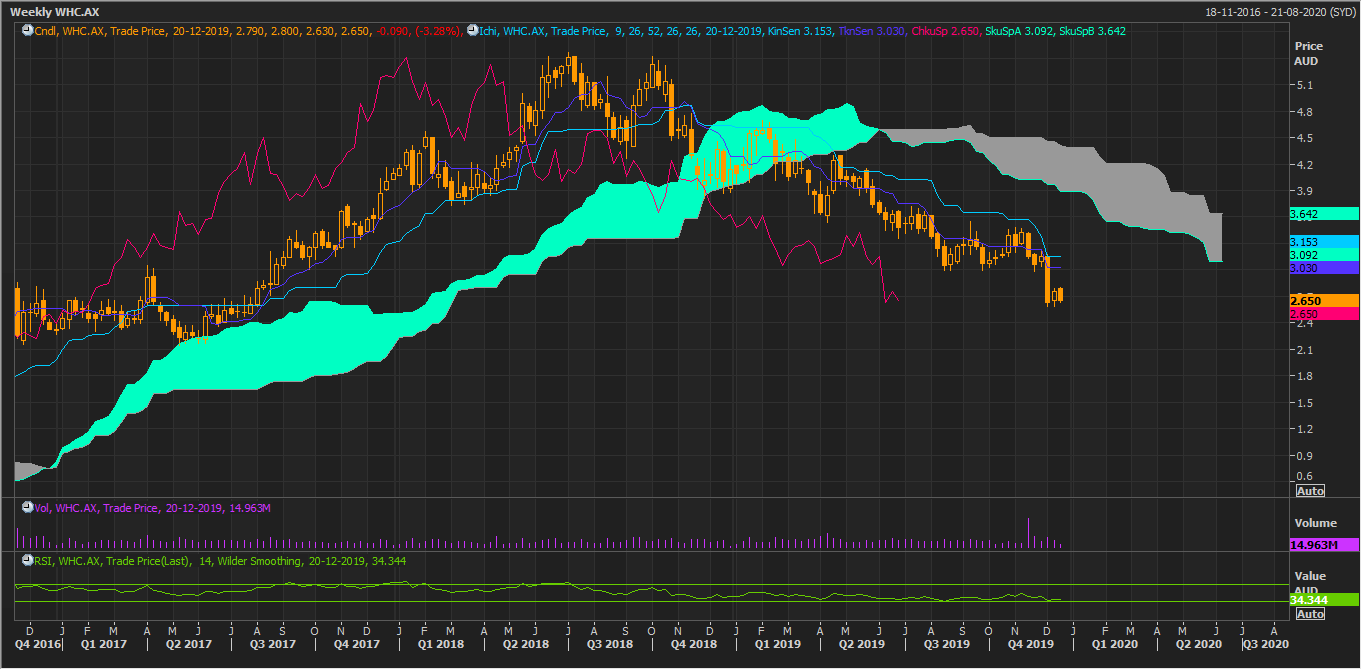
WHC Weekly Chart (Source: Thomson Reuters)
Post applying the Ichimoku clouding technique on the weekly chart, it could be noticed that the share prices are currently below Span A, which is a mean of the conversion line and the base line. The spread between Span A and Span B (mean of 52-day high and low) is enlarging, which shows that the downtrend is gaining strength.
The conversion line (dark blue), which is the mean of 9-day high and low, is currently trading below the base line (mean of 26-day high and low), which increase the probability of a short-term up rally, provided that the prices trade in positive territory for two or more consecutive weeks.
The upside Fibonacci projections for WHC are as below:
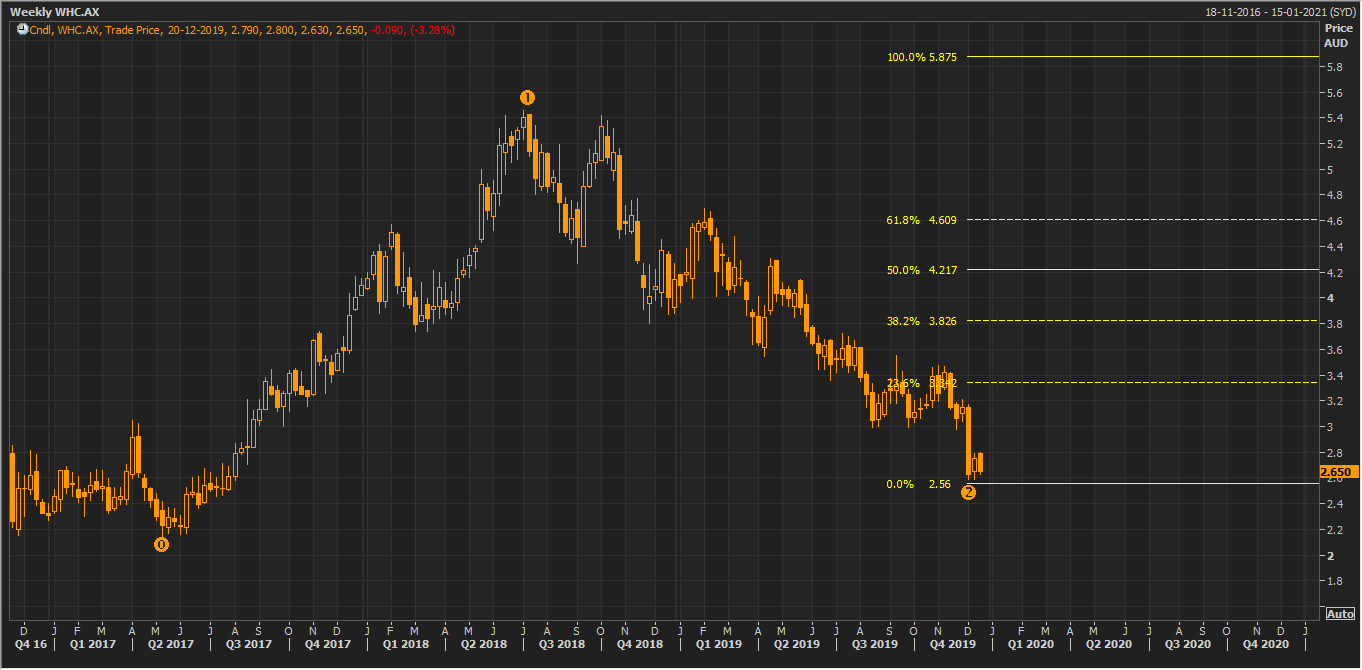
WHC Weekly Chart (upside Projections) (Source: Thomson Reuters)
The downside projections are as below:
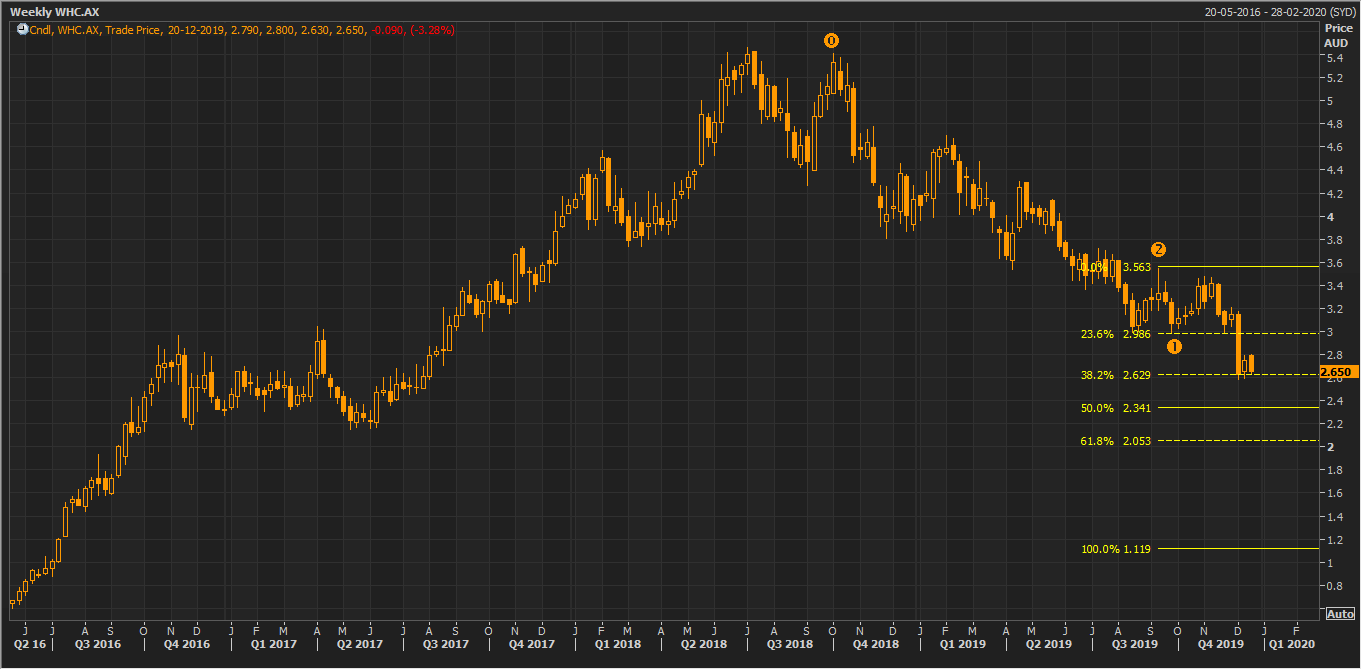
WHC Weekly Chart (downside Projections) (Source: Thomson Reuters)
New Hope Corporation Limited (ASX: NHC)
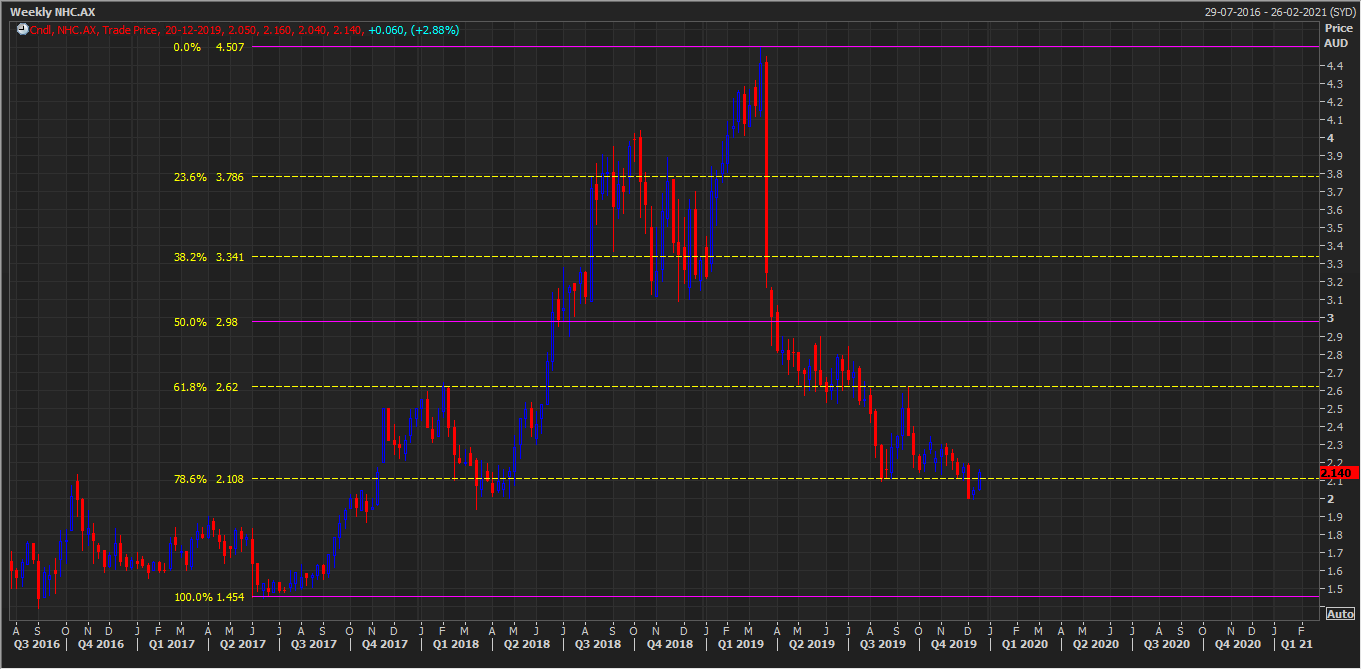
NHC Weekly Chart (Source: Thomson Reuters)
On the weekly chart, NHC took over 78.6 per cent correction of the primary rally, which started from approx. $1.454 (second quarter 2017) to the level of $4.507 (first quarter 2019). The corrected level of 78.6 is itself intriguing as the academics suggest that the higher retracement instigate high buying interest, provided decent or strong fundamentals or future outlook.

NHC Weekly Chart (Source: Thomson Reuters)
Post applying the Ichimoku clouding technique on the weekly chart, it could be seen that the stock is presently trading below Span A with an enlarged gap between Span A and Span B, which further suggests that the downtrend is prominent.
The Conversion line had crossed the base line above Span A, which coupled with declining volume trend suggests that the bears are currently leading the prices. From the past two weeks, slight buying interest could be observed, which led a spike in the 14-day Relative Strength Index.
In both the coal mining stocks, the cloud grey cloud is the resistance zone, and investors should monitor the zone closely, as a break and sustain above the same would decide further price actions in the share prices of the company.
The upside Fibonacci projections for NHC are as below:
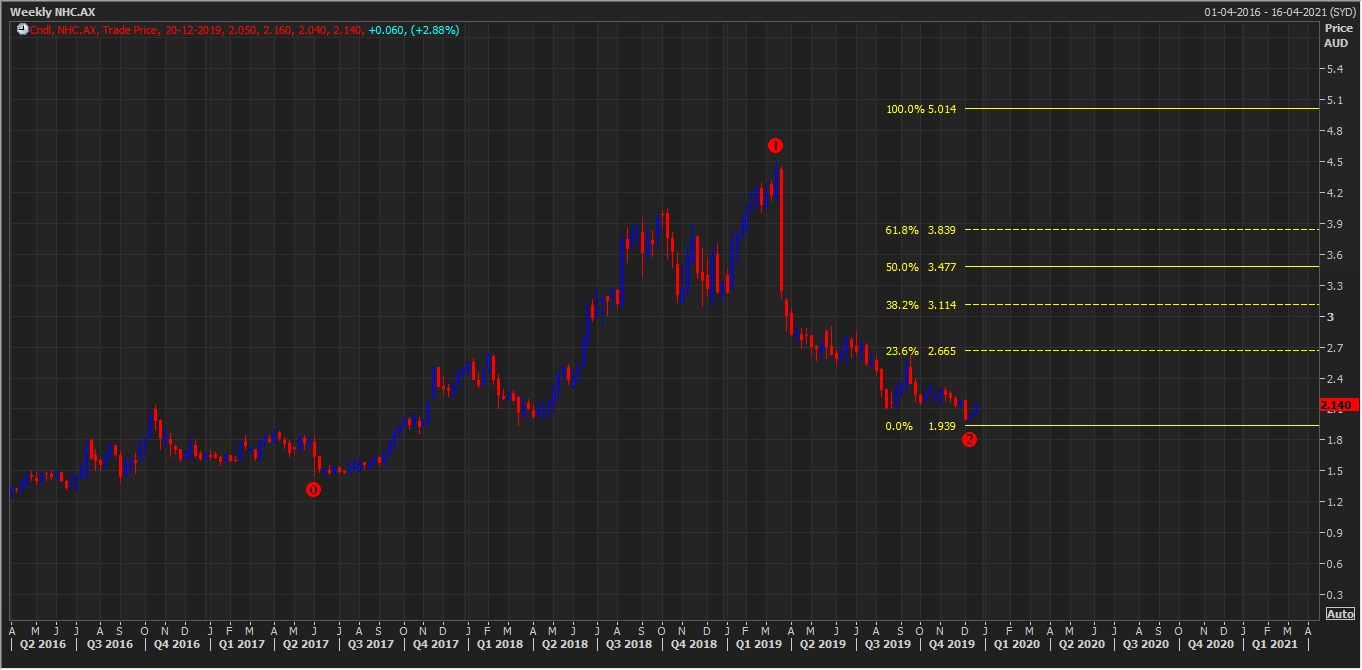
NHC Weekly Chart (upside Projections) (Source: Thomson Reuters)
The downside Fibonacci projections are as below:
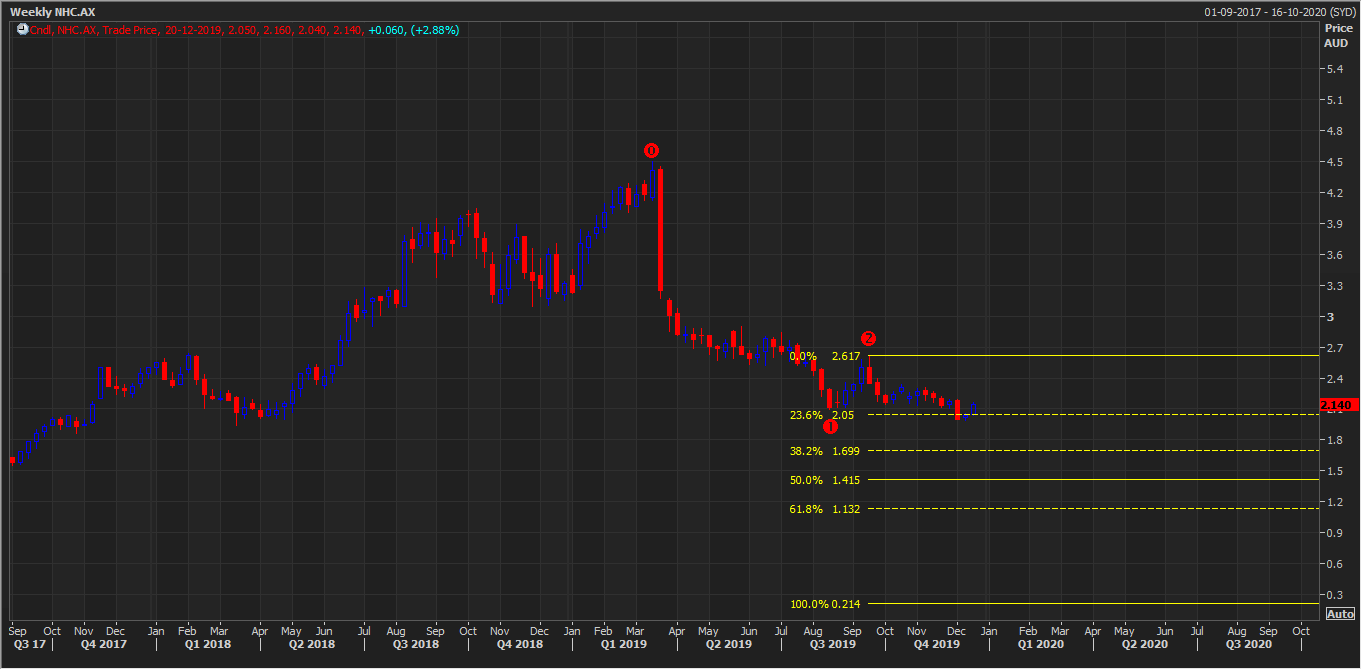
NHC Weekly Chart (downside Projections) (Source: Thomson Reuters)
Juicy Dividend Yield (as of 18 December 2019 prices)
WHC is trading at $2.655 marking a healthy dividend yield of 10 per cent.
NHC is trading at $2.145 marking a dividend yield of 7.94 per cent.
Disclaimer
This website is a service of Kalkine Media Pty. Ltd. A.C.N. 629 651 672. The website has been prepared for informational purposes only and is not intended to be used as a complete source of information on any particular company. Kalkine Media does not in any way endorse or recommend individuals, products or services that may be discussed on this site. Our publications are NOT a solicitation or recommendation to buy, sell or hold. We are neither licensed nor qualified to provide investment advice.
