


In a game of poker, blue chips are regarded to be the most valuable chips. On the similar lines, in financial terms, blue-chip stocks refer to the shares that pertain to a company that is well-established, is financially stable and has sustained in the business for a long time. These stocks pay dividends that are stable and on the rise. Considering this criteria, blue-chip stocks have large market capitalization, and ideally leads the sector it prevails in.
Few examples of blue-chip companies are Coca Cola Co., Walt Disney, Apple, Goldman Sachs, Visa and McDonalds.
Below are some of the trending blue-chips shares trading on the Australian Securities Exchange:
- Amcor Plc. (ASX: AMC)
- ANZ Banking Group Limited (ASX:ANZ)
- BHP Group Limited (ASX:BHP)
- Brambles Limited (ASX:BXB)
- Commonwealth Bank Limited (ASX: CBA)
In the light of this backdrop, let us now look at the recent updates and present stock performances of two blue-chip shares, trading on ASX- NAB and WES:
National Australia Bank Limited (ASX:NAB)
Company Profile: Australiaâs largest business bank, NAB has been in the business for over 160 years. The bank caters to customers in over 900 locations in the ANZ region and across the globe. The company works with small, medium and large businesses and funds infrastructural activities as well. The bank was listed on ASX in 1974 and has its registered office in Docklands.
Stock Performance: On 3 July 2019, NAB is trading at A$26.500 (as at 12:19 PM AEST), up by 0.038 per cent, relative to its last trade. With one of the largest market capitalisations (in its sector) of ~A$74.47 billion, NAB is trading with approximately 2.81 billion outstanding shares. The annual dividend yield has been 6.79% and the stockâs P/E ratio is 13.060x. In the past one, three and six months, the stock has generated returns of 0.61 per cent, 4.25 per cent and 12.10 per cent, respectively.
Issue of New Shares: On 3 July 2019, the company issued 71,602,209 fully paid ordinary shares including:
- 32,626,090 issued under NABâs DRP scheme.
- 38,052,763 issued to Citigroup Global Markets Australia Pty Limited at an issue price of A$26.2793 for the underwriting arrangements under its DRP wrt 2019 interim dividend.
- 932,356 issued under NABâs Bonus share plan.
On 2 July 2019, the company issued 17,058 shares under the National Australia Bank Staff Share Ownership Plan and National Australia Bank Executive Participants Staff Share Scheme, aggregating to $430,352.90.
Half-year Results: On 2 May 2019, the company presented its 1H19 financial highlights and stated that the company had faced a terse period with the Royal Commission urging it to take actions to fix any issues and win back the trust of its customers. The bank has stayed focussed on taking necessary actions to address community and customer expectations. The company has been resetting its financial parameters- with CPS conversion of $750 million, DRP up to $1.8 billion and $1.1 billion in remediation charges with more to come. Moreover, APRA self-assessment was being conducted as a regulatory measure.
The Net Operating Income was up by 1.4 per cent on pcp and the operating expenses were up by 1.7 per cent. The net interest margin was down by 7 basis points. The financial highlights of the bank are depicted in the image below:
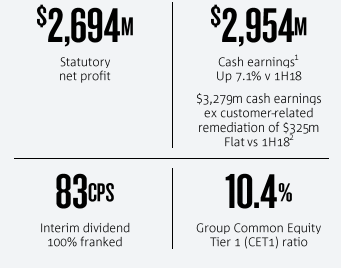
Financial highlights for 1H19 (Source: Companyâs report)
NABâs Outlook: The company is anticipating a slow GDP growth of 2 per cent in 2019. The unemployment is low at 5 per cent and the house credit is slowing as well. NAB expects an approximately 3 per cent annual growth in FY19 and FY20. In this slumped economic environment, the companyâs confidence is below average, as compared to the past years.
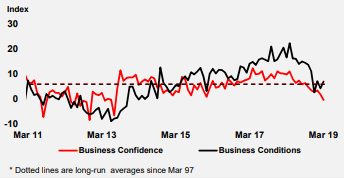
NABâs business conditions and confidence over the years (Source: Companyâs report)
On 27 June 2019, the company notified that it would release its 2019 financial year third quarter trading update on Wednesday 14 August 2019.
Wesfarmers Limited (ASX: WES)
Company Profile: Counted amongst the countryâs largest listed companies, WES is a business giant providing apparel, home improvement and outdoor living products, office supplies and has a diversified wing with businesses in the industrial, chemical, energy and fertiliser sector as well. The company originated in 1914 and was listed on the ASX in 1984. The headquarters of WES is in Perth.
Stock Performance: On 3 July 2019, WES is trading at A$36.415, up by 0.76 per cent, relative to its last trade. With one of the largest market capitalisations (in its sector) of ~A$40.98 billion, the company is trading with approximately 1.13 billion outstanding shares. The annual dividend yield has been 6.09% and the stockâs P/E ratio is 7.390x. In the past three and six months, the stock has generated returns of 4.81 per cent and 17.90 per cent, respectively.
WESâs Strategy Briefing Day: The company conducted a Strategy Briefing Day in Sydney on 13 June 2019. The company stated that in FY19, it had successfully undergone the demerger of Coles and disinvestments of Bengalla, Kmart Tyre & Auto and Quadrant Energy. It had also formed the flybuys joint venture, focussing on investment opportunities.
The company had agreed to the scheme implementation deed towards the acquisition of Kidman Resources on 23 May 2019. The scheme is expected to be completed in September this year. As per the company, this is a great path to venture out in the business of electric vehicle and enhance its capabilities in the field of chemical processing, which is anticipated to boom in the coming times.
Besides this, the company notified that it would be acquiring Catch Group, a leading Australian online retailer for $230 million, which is subject to the ACCC approval, expecting to receive a green signal in the coming few months.
On the financial end, WESâs Divisional cash generation from continuing operations has averaged more than 100 per cent since FY14. The company has steadily focussed on working capital efficiencies. In FY19, the net capital expenditure is expected to be in the range of $800 million and $850 million. The interest expense is expected to be between $170 million and $180 million.
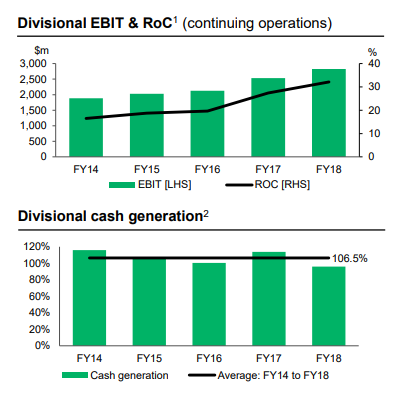
WESâs cash flow generation (Source: Companyâs report)
Disclaimer
This website is a service of Kalkine Media Pty. Ltd. A.C.N. 629 651 672. The website has been prepared for informational purposes only and is not intended to be used as a complete source of information on any particular company. Kalkine Media does not in any way endorse or recommend individuals, products or services that may be discussed on this site. Our publications are NOT a solicitation or recommendation to buy, sell or hold. We are neither licensed nor qualified to provide investment advice.
