
Definition
Related Definitions
Bullish Harami
What is Bullish Harami?
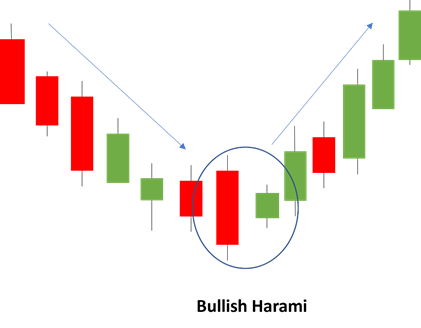
A bullish harami is a candlestick reversal pattern that appears at the bottom of a downtrend in an asset price. A bearish candle with a long body precedes a bullish candle with a small body- the latter encompassed within the body of the preceding candle.
Copyright © 2021 Kalkine Media
Highlights
- Bullish harami is a bullish reversal two candle price pattern on a candle stick chart.
- The bullish harami pattern marks the beginning of an upward movement in prices of an asset following a prolonged decline.
Frequently Asked Questions
What is the Japanese candlestick?
A Japanese candlestick chart is a form of a chart that shows the open and close prices of an asset in the market using a rectangular body. It measures the price performance within a given time interval. It is named after the rectangular shape represented in the chart, which resembles a candle with wicks, projecting from the top and bottom.
Individual candlesticks build patterns over time, which traders can use to identify critical support and resistance levels. The patterns can also reveal buying pressures and selling pressures.
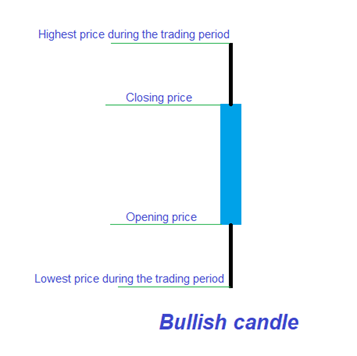
The bullish candle has three parts-
- The central body connecting the opening and closing price. Here the closing price is at the top end.
- The upper wick connecting the highest price level hit during the trading period to the closing price.
- The lower wick connecting the lowest price of the trading period to the opening price.
Copyright © 2021 Kalkine Media
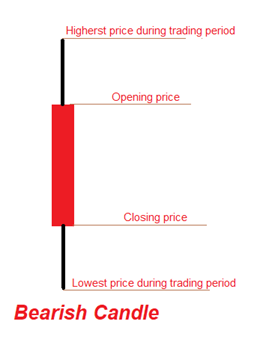
In the case of a bearish candle, the three parts are-
- The central rectangular body connects the opening and closing price, but in this case, the closing price is at the bottom end.
- The upper wick connecting the highest price level hit during the trading day to the opening price
- The lower wick connecting the lowest price of the trading period to the closing price.
Copyright © 2021 Kalkine Media
A candlestick is a visual representation of information regarding the price movement of an asset.
Candlestick chart analysis are one of the most popular types of technical analysis because they allow traders to evaluate price data using only a few price bars quickly.
What is the Harami candle pattern?
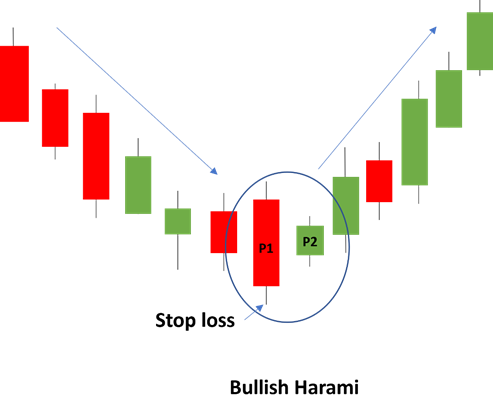
Harami is a Japanese word used for pregnant. The harami pattern of the candlestick chart is a combination of two candles evolving over two periods say P1 and P2. The first one is long while the second is small. The colours of the two bars are opposite. When a harami pattern appears, it implies the reversal of the trend i.e. from upward to downwards or downwards to upwards. The former is called bearish harami, while the latter is known as bullish harami. A long trade is usually initiated after P2.
How does the bullish harami pattern work?
We can try to understand the harami pattern taking the example of a month-long trading period. Initially, the market is on a downward spree due to which prices crash lower and lower, making the markets bearish. For instance, assume on the twentieth day of the month under observation, a new low is formed- the opening price is US$6, and the closing price is US$3 leading to the formation of a red candle. The next day opens at US$4 and closes at US$5 (less than the opening price for the previous day), thus forming a blue candle. The small blue candle appears like a foetus within the last day's red- this justifies the Japanese term harami. The blue candle, which suddenly appears after a red trail when it is not expected, triggers the weakening of the bearish trends and becomes a boost for the bulls to make an attempt. This trend will push the prices higher. At this point, the risk-taking traders must decide to go long on the stock at the closing price of US$5.
On the other hand, the risk-averse traders could wait for another trading day and go long once they confirm that a blue candle is formed. After initiating, the trader can wait to hit the target maintaining a stop loss. The trader should set the stoploss trade at the lowest of the prices between P1 and P2.
Copyright © 2021 Kalkine Media
The trend explained above is bullish harami if a prominent and visible downswing precedes it in prices indicated by multiple red candles over various days.
What are the other bullish candlestick patterns?
Some of the other bullish candlestick chart patterns are as follows-
- Hammer- The hammer pattern shows that initially, the prices were being pushed down due to excess selling pressure but gradually, buying pressure exceeded, and prices shot up.
- Inverse hammer – The inverse hammer indicates that initially, there was buying pressure which was later followed by a selling pressure not enough to drive down market prices.
- Bullish engulfing- This pattern is formed with two candlesticks of opposite colours- bearish followed by bullish indicating the possibility of an upward movement in prices
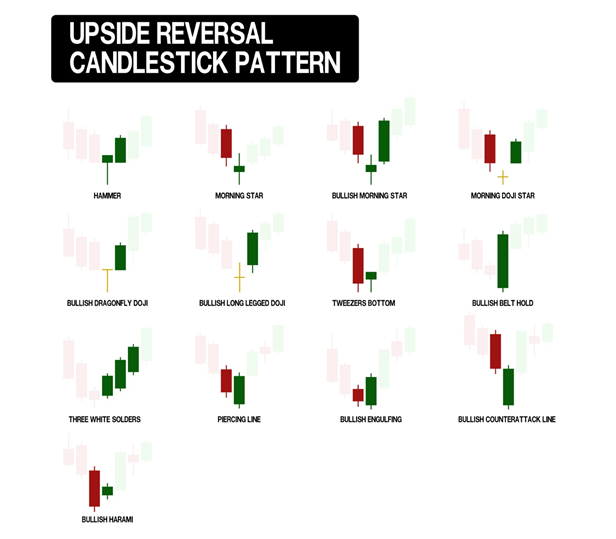
Set Of Red And Green Upside Reversal Candle Stick Pattern © Heavypong | Megapixl.com
- Three white soldiers - This pattern is in three long bullish blue candles indicating progressively higher prices.
- Morning Star - In a market downturn, the morning star candlestick pattern is a symbol of hope. It's a three-stick pattern with one short-bodied candle sandwiched between two long red and blue candles. The 'star' will typically have no overlap with the lengthier bodies. It indicates that the selling pressure from the first day has subsided and that a bull market is approaching.