


Summary
- Iron ore is trading under pressure on the global front with iron ore futures on the Dalian Commodity Exchange (or DCE) tumbling over 8 per cent from its recent high.
- The decline in iron ore prices is largely due to a recovery in the iron ore supply chain with shipment from Australia and Brazil witnessing a weekly increase (for the period ended 26 June 2020).
- In the middle of a price plunge in iron ore ASX-listed iron ore stocks such as Rio Tinto Limited (ASX:RIO), Fortescue Metals Group Limited (ASX:FMG) are coming under the scanner of chartist in the wake of some interesting charts developments.
Iron ore prices are finally showing an impact of recovering supply chain with prices of iron ore futures on the Dalian Commodity Exchange tumbling from RMB 798.00 per dry metric tons to the recent low of RMB 733.00 per dry metric tons (intraday low on 29 June 2020), which marks a price fall of ~ 8.14 per cent.
To Know More, Do Read: Iron Ore Futures Predisposed to China’s Steel Industry Revival
The decline in iron ore prices is now putting pressure on ASX-listed iron ore stocks, which previously rallied over the iron ore supply woes, with some such as Fortescue Metals Group Limited (ASX:FMG) even reaching a record high.
To Know More, Do Read: Fortescue Metals Breaking All Records!! Here’s Why?
DCE Iron Ore Futures (September Expiry) on Charts
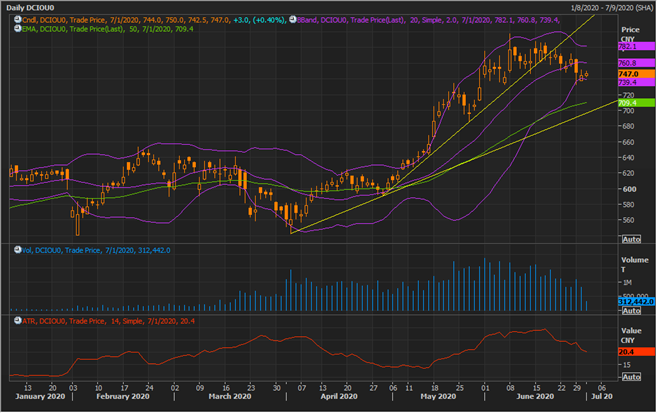
Iron Ore Futures Daily Chart (Source: EODHD/Others Eikon Thomson Reuters)
On the following the daily chart of iron ore futures (September expiry), it could be seen that the commodity is now trading below its steeper trendline, which should now act as immediate resistance for the price.
Furthermore, it should be noticed that the 20-day simple Bollinger band is now shrinking, which coupled with a downward sloping Average True Range, reflecting lower volatility, while prices are trying to recover. Also, every down candle (dark candle) is supported with higher volumes as compared to the hollow candles (up candle), suggesting that at present bearish sentiments might be taking roots.
The flatter trendline should act as the near-term support for the commodity, while the steeper trendline should act as resistance.
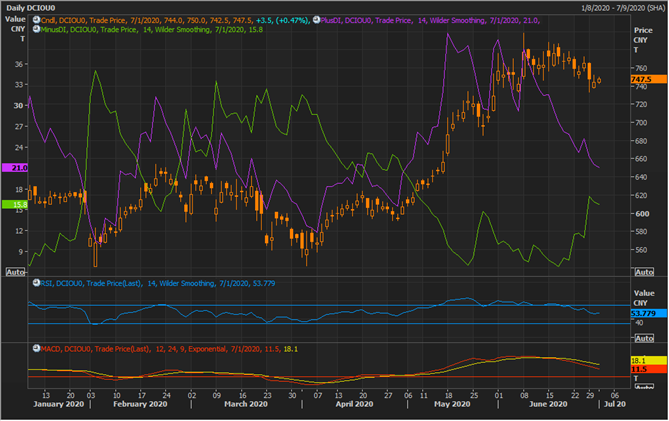
Iron Ore Futures Daily Chart (Source: EODHD/Others Eikon Thomson Reuters)
On applying the plus and minus DI on the daily chart, it could be seen that the spread between them is now narrowing down with plus DI moving towards minus DI from above, suggesting that the upside rally of iron ore is now losing momentum.
The 12,24,9 MACD indicator is also giving a negative signal, which coupled with a downward sloping 14-day Relative Strength Index is confirming that bulls are losing steam now. However, while bulls might be taking a breather and with technical indicators giving somewhat bearish signals, the future direction of the commodity would depend upon the ability of iron ore to breach its near-term price resistance or its inability to do the same.
Stocks Following The Iron Ore Lead
- Fortescue Metals Group Limited (ASX:FMG)
Post rallying from the level of $8.200 (intraday low on 13 March 2020) to the recent high of $15.250 (intraday high on 9 June 2020) to mark a price appreciation of ~ 85.97 per cent, the stock of the Company came under pressure from correcting iron ore prices, and FMG tumbled from $15.250 to the present low of $13.625 (as on 1 July 2020).
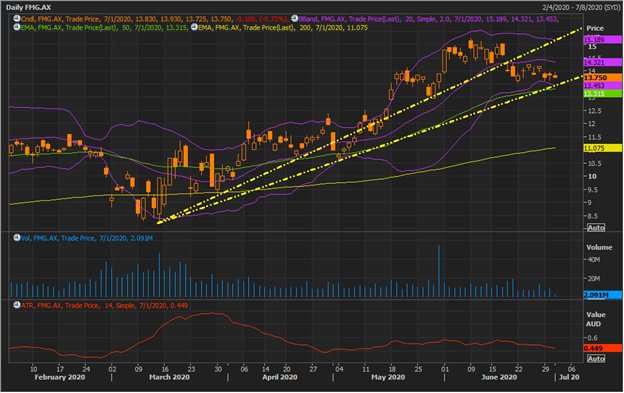
FMG Daily Chart (Source: EODHD/Others Eikon Thomson Reuters)
On the daily chart, it could be seen that the stock is closely tracking the change in iron ore prices with FMG slipping below its steeper trendline and below the mean value of 20-day simple Bollinger band.
At present, the stock is testing the support of its flatter trendline, which is decisive and holds weightage as the same line is merging with the -2 standard deviation of the Bollinger band.
The steeper trendline should act as near-term resistance for the stock; however, it should be noticed that the stock is moving towards the -2 SD while the Average True Range is sloping downside, suggesting that the falling momentum near the support is going weak, which coupled with the ability of the stock to sustain above the flatter trendline support could seed bullish sentiments ahead.
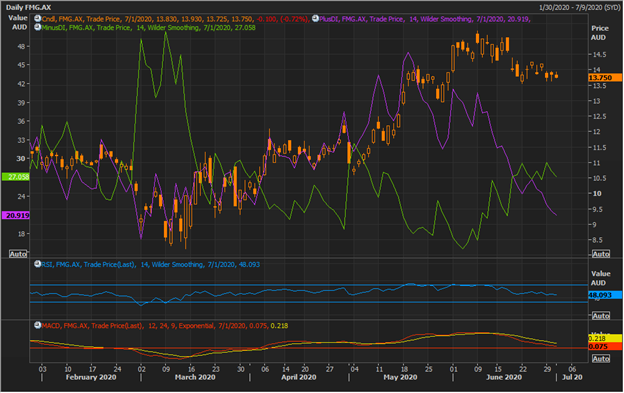
FMG Daily Chart (Source: EODHD/Others Eikon Thomson Reuters)
On further following the daily chart of FMG, it could be seen that the pair of plus DI and minus DI is showing a negative cross, which coupled with a negative signal from 12,24,9 MACD indicator is suggesting that bullish sentiments prevail over the short-term.
However, at present, the spread between plus DI and minus DI is not so large, which should be monitored to gauge the future sentiment around the stock. Furthermore, the spread would eventually enlarge if the stock breaches its support trendline and -2 SD.
Also, the 14-day RSI is also slowing a downside slope and is currently below its mean value and above the oversold zone.
- Rio Tinto Limited (ASX:RIO)
The stock of the Company followed the same trajectory on the exchange as its peer FMG with prices surging from the level of $72.770 (intraday low on 13 March 2020) to the level of $103.260 (intraday high on 9 June 2020) to mark a price gain of ~ 41.89 per cent, before trading under pressure due to a decline in iron ore prices.
The stock plunged after hitting a high of $103.260 to the level of $95.120 (intraday low 22 June 2020) and is hovering around the same level since then.
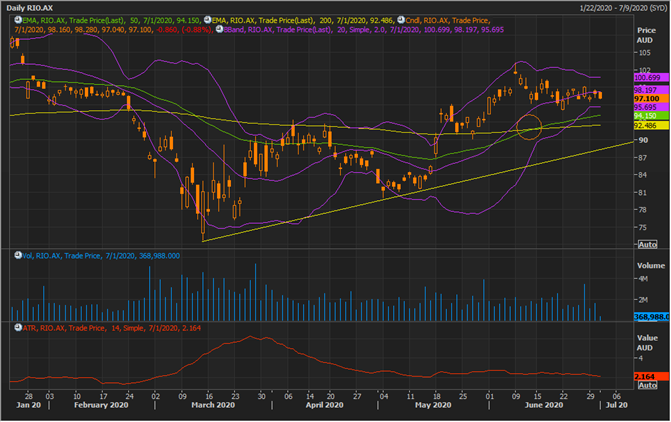
RIO Daily Chart (Source: EODHD/Others Eikon Thomson Reuters)
On following the daily chart of Rio, it could be seen that the stock is presently trading above the pair of 200- and 50-day exponential moving average with 50-day crossing the 200-day EMA from below to establish a positive crossover.
The 20-day simple Bollinger band is narrowing down, which coupled with a declining Average True Range suggests that the stock is finally taking a breather from the down plunge.
The primary support for the stock is at the -2 SD of the Bollinger and the same support would be decisive in nature as both the 50-day EMA and 200-day EMA are overlapping around the same zone.
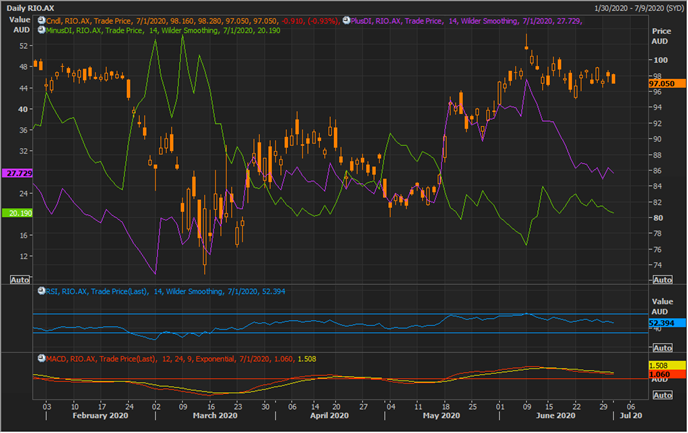
RIO Daily Chart (Source: EODHD/Others Eikon Thomson Reuters)
On applying the plus and minus DI on the daily chart, it could be seen that the stock is so far trading with a positive cross between the plus and minus DI; however, the spread between them are now narrowing down, which coupled with a negative signal from 12,24,9 MACD and downward sloping RSI, suggests that short-term trading sessions of the past have been dominated by bears.
The crossing of plus and minus DI would depend upon the inability of RIO to sustain above its crucial support level.
