


Australian iron ore mammoth Fortescue Metals Group Limited (ASX: FMG) posted a bumper financial performance for the year ended 30 June 2019. The improved operational efficiency led the company to flag a net profit after tax (or NPAT) of US$3,187 million, up by 263 per cent from FY2018.
Operational Efficiency:
FMG mined 206.7 wet metric tonnes of ore during the financial year 2019, which underpinned the growth of 12 per cent from FY2018. The company processed 7 per cent more ores in FY2019 as compared to FY2018.
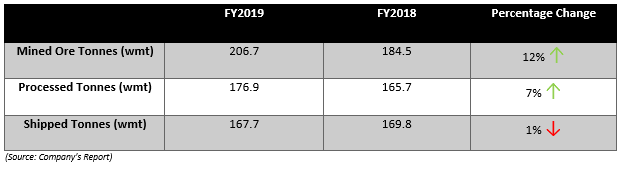
Apart from higher efficiency, an increase in realised price also boosted the profit margins of the company, and despite a 1 per cent decline in the quantity of shipped ore, FMG total revenue witnessed a 45 per cent increase in FY2019.
The average realised price for the financial year 2019 stood at US$65 per dry metric tonne, up by 48 per cent against the FY2018 realised price of US$44 per dry metric tonne. The shipped tonnes stood at 167.7 wet metric tonnes in FY2019 (169.8wmt in FY2018).
The total revenue for the financial year 2019 stood at US$9,965 million as compared to the FY2018 revenue of US$6,887 million.
Product Shipment:
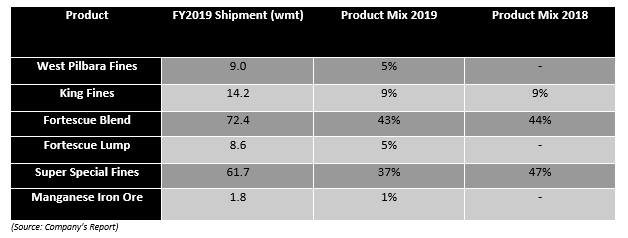
The shipment witnessed a minor fall of 1 per cent; however, the product mix marked a decline in product blends.
Revenue Contributors:
The higher realised price of iron ore during the second quarter of the calendar year 2019, coupled with an increase in shipment of high-grade product such as West Pilbara Fines propelled the revenue in FY2019.
The iron ore products witnessed a demand surge in China during the second quarter of the calendar year 2019, which in turn also supported the companyâs product demand, and in a loop- the revenue.
While the demand of iron ore in China remained robust during the second quarter in CY2019, the supply chain was disturbed over the impact of the Tropical Cyclone Veronica at the Pilbara Region, which disrupted the operations of ASX-listed iron ore miners and also caused slower delivery from the Port Hedland.
The supply disruption was widened by the cyclone post the initiation of disruption in the supply chain from Brazil. The Brazilian iron ore giant-Vale faced a suspension post a dam collapse in Brazil, which reduced the Brazilian supply, and the impact of cyclone magnified the supply disruption.
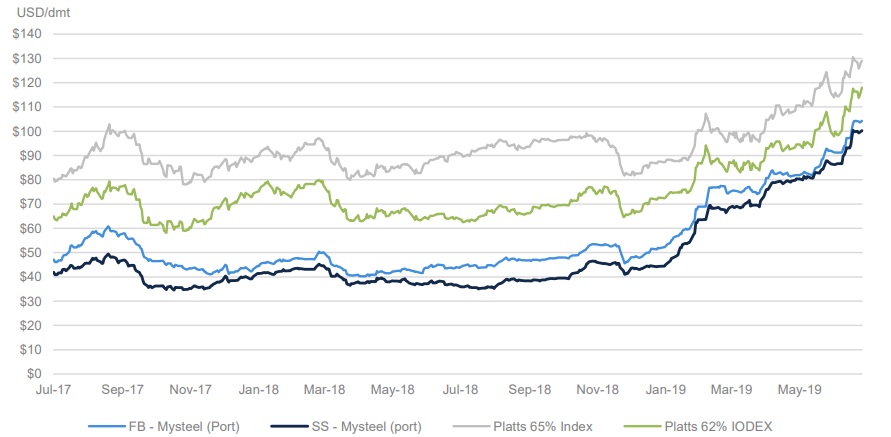
Over the supply disruption, the iron ore price benchmark zoomed in the international market, and FMGâs products such as the Fortescue Blend and Super Special Fines followed the same trajectory.
(Source: Companyâs Report)
The cash operating cost (or C1) averaged at US$13.11 per wet metric tonnes in FY2019, which was 6 per cent higher as compared to the previous corresponding year. FMG mentioned that the cash cost witnessed an increase amid high fuel cost, improved wages and due to longer haul distances.
FY2020 Guidance:
FMG kept the shipment guidance in the range of 170mt to 175mt, including 17 to 20 mt of West Pilbara Fines. The company anticipates even higher cash cost in FY2020, and FMG kept the C1 costs guidance in the range of US$13.25 to US$13.75 per wet metric tonne.
FMG allocated US$2.4 billion capital for FY2020 and distributed the expenditure as:
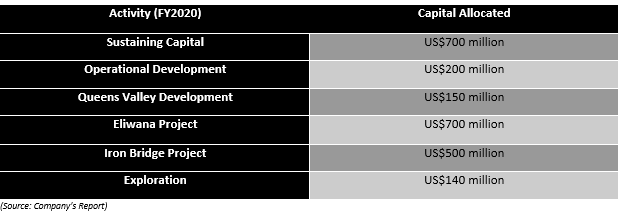
Dividend Growth:
FMG declared a final fully franked dividend of A$0.24 a share, which in turn, took the total yearly dividend to A$1.14 per share.
The dividend of the company witnessed a yearly growth of 396 per cent in FY2019.
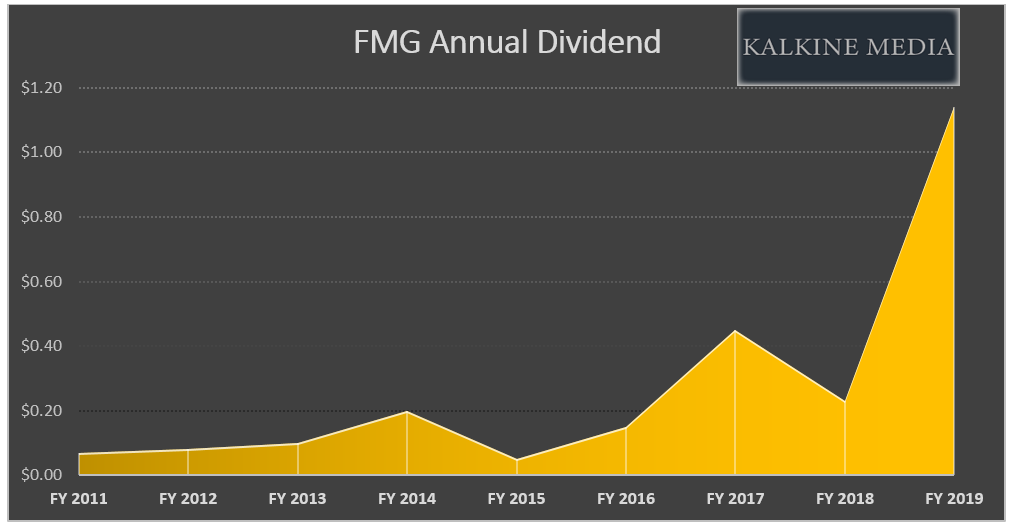
The yearly dividend of A$1.14 represented a pay-out ratio of 78 per cent, and FMG kept the dividend distribution guidance for FY2020 in the range of 50 to 80 per cent of the full-year NPAT.
Share buy-back:
FMG launched an A$500 million on market share buy-back program in October 2018, and to date, the company acquired A$139 million worth of shares at an average price of A$3.997 per share. As per the company, all shares which FMG bought have been cancelled, and the current share buy-back program would expire on October 2019.
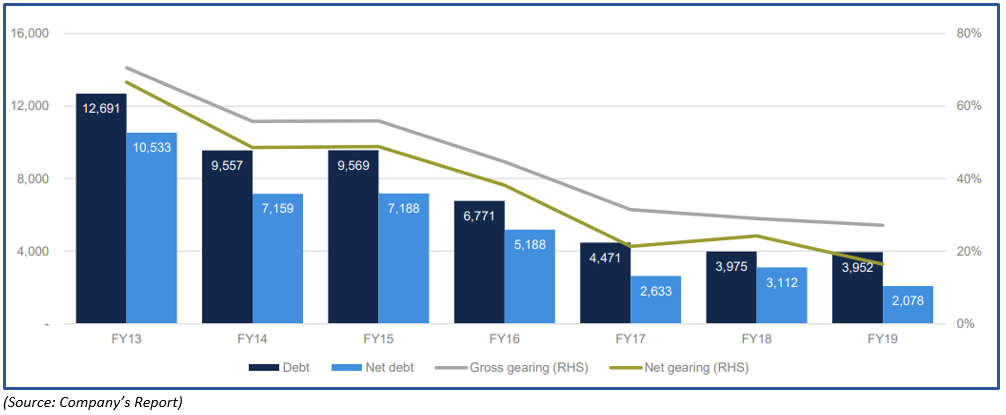
Debt-Reduction:
FMG is consistently reducing its debt from the financial year 2013, and the total debt, which ballooned to A$12,691 million in FY2013 now stands at A$3,952 million (as on 30 June 2019).
Return Profile:
The total returns delivered by FMG over the long and short-term are:
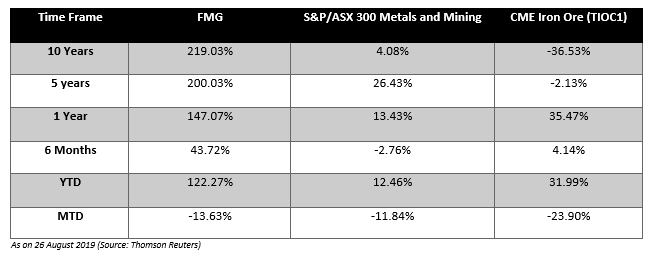
In a nutshell, the financial year 2019 for FMG remained strong, and the company posted bumper profits; however, in the status quo, the global economic conditions are gloomy, which is dragging down the iron ore demand in the international market, and investors should monitor the global growth scenario to gauge the iron ore demand in future.
FMG on Charts:
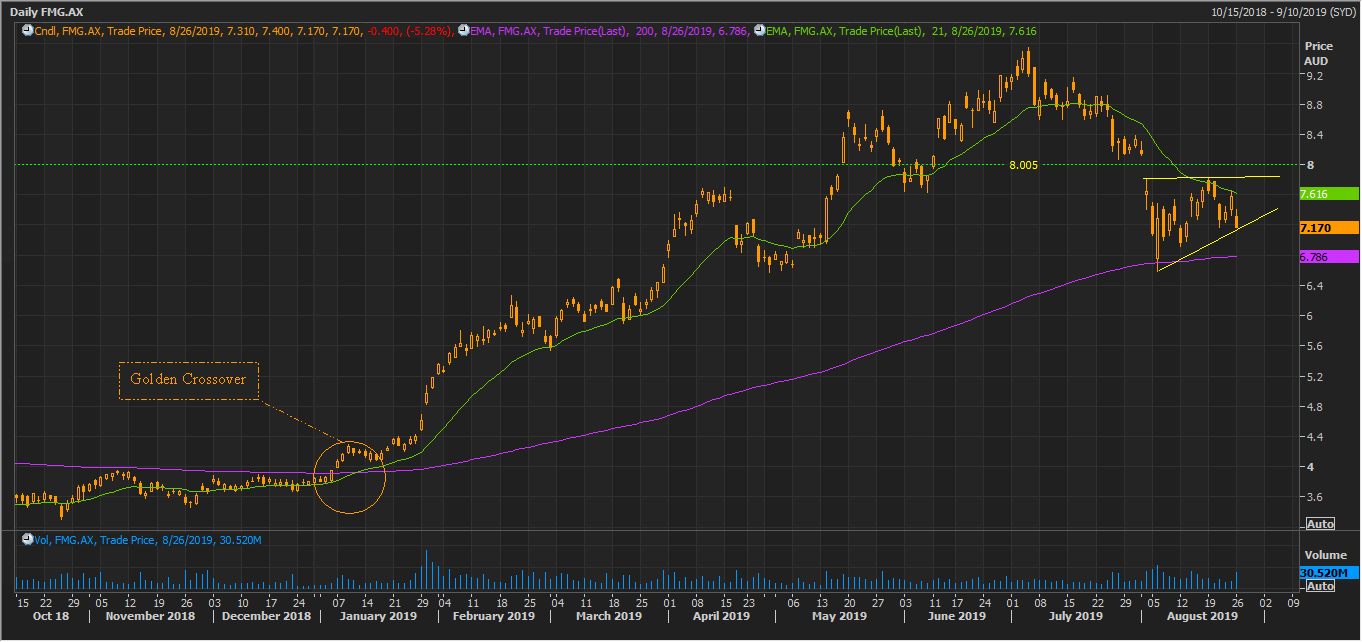
FMG daily chart (Source: Thomson Reuters)
On the daily chart, the shares rallied from December 2018 till July 2019 amid an increase in iron ore prices. During the starting of the rally, the trading actions generated a golden crossover (bullish signal) of 21- and 200-days exponential moving averages.
However, the prices corrected by almost 50 per cent of the primary rally, which started in December 2018, and is now forming an ascending triangle on a daily chart. The primary support for the shares is at its 200 days EMA, which is at A$6.786.
The prices rose slightly in the previous few trading sessions, which in turn, dragged down the short-term EMA of 21 days, which would now act as the primary hurdle for the share prices of the company.
The breaking of the triangle either up or down would decide further price action of the shares. Meanwhile, the major hurdle for the prices is intact at A$8.005.
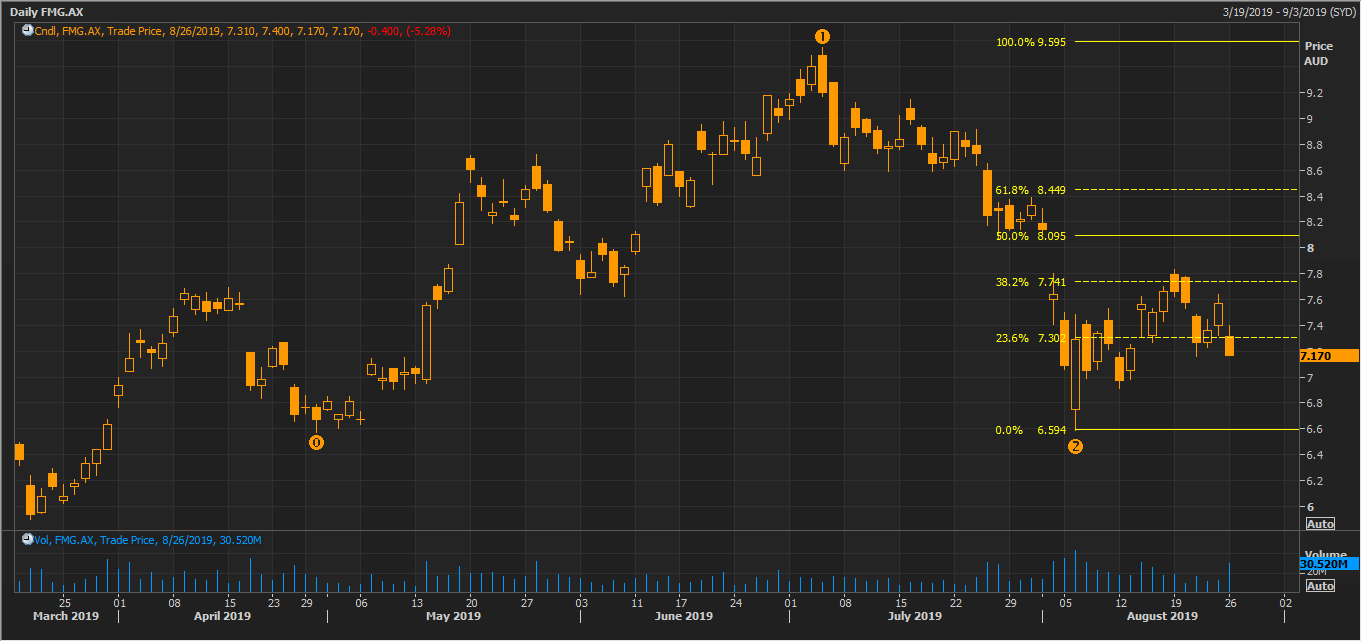
FMG daily chart (Source: Thomson Reuters)
On projecting the Fibonacci, the prices have taken a turnaround from the 38.2 per cent level; however, the projections from the Fibonacci remains intact until the share price crosses the low of the candle marked as 2 on the chart shown above.
Investors should monitor the levels mentioned above carefully and should also follow the development of the triangle formation to gauge the price direction ahead.
Disclaimer
This website is a service of Kalkine Media Pty. Ltd. A.C.N. 629 651 672. The website has been prepared for informational purposes only and is not intended to be used as a complete source of information on any particular company. Kalkine Media does not in any way endorse or recommend individuals, products or services that may be discussed on this site. Our publications are NOT a solicitation or recommendation to buy, sell or hold. We are neither licensed nor qualified to provide investment advice.
