
_07_20_2026_01_11_05_769979.jpg)


Iron ore prices are under deep pressure over production curbs and weakening demand in China. Despite the shortfall in inventory across the 35 significant Chinese ports, the iron ore prices on the Dalian Commodity Exchange (or DCE) plunged by ~33% to the level of RMB 622.50 (Dayâs close on 19 August 2019) from its recent multi-year high of RMB 924.50.
The prices in the international market followed the same trajectory, and the prices of iron ore futures on the Chicago Mercantile Exchange dropped to the level of US$94.36 a tonne (Dayâs close on 19 August 2019) from its recent peak of 117.88 (Dayâs close on 15 July 2019).
Iron Ore Supply Chain:
Iron ore inventory across 35 crucial ports in China shrank by 2.30 million tonnes to stand at 105.81 million tonnes, down by 1.88 per cent for the week ended 16 August 2019, as compared to the previous corresponding period.
However, the new arrivals across the Chinese ports somewhat offset the shortfall in inventory. As per the data, 99 vessels carrying 14.41 million metric tonnes arrived across the Chinese ports from 11 August 2019 to 17 August 2019.
The new arrivals were 4.98 million metric tonnes higher as compared to the previous corresponding period.
These new arrivals were anticipated by the market to add across the ports inventory in China, which would be reported on 23 August 2019.
Steel Inventory, Price, and Demand:
The steel inventory in China also took a hit amid production curbs in various steelmaking provinces in China due to adverse weather conditions.
As per the data, the overall steel inventory in China stood at 14.74 million tonnes, down by 0.57 per cent for the week ended 16 August 2019, as compared to the previous corresponding period.
Tangshan city government decided to deepen the production cuts between 18 August 2019 to 21 August 2019 amid poor weather conditions. Currently, during the production curb phase, only one sintering machine at the northern plant of Tangshan is operational.
A couple of steel producers from the Tangshan province such as Huaxi Steel and Guoyi Steel are allowed to run two sintering machines each; while the other steel producers are advised to strike down 50 per cent of the sintering capacity in the provinces.
Despite the fall in overall steel inventory and production curbs, the weak demand for steel in the global market exerted pressure on the steel prices.
The prices of steel rebar 1-month future contract on the London Metal Exchange dropped from the level of US$477.5 per tonne to the level of US$451 per tonne, which in turn, represents a fall of over 5.50 per cent.
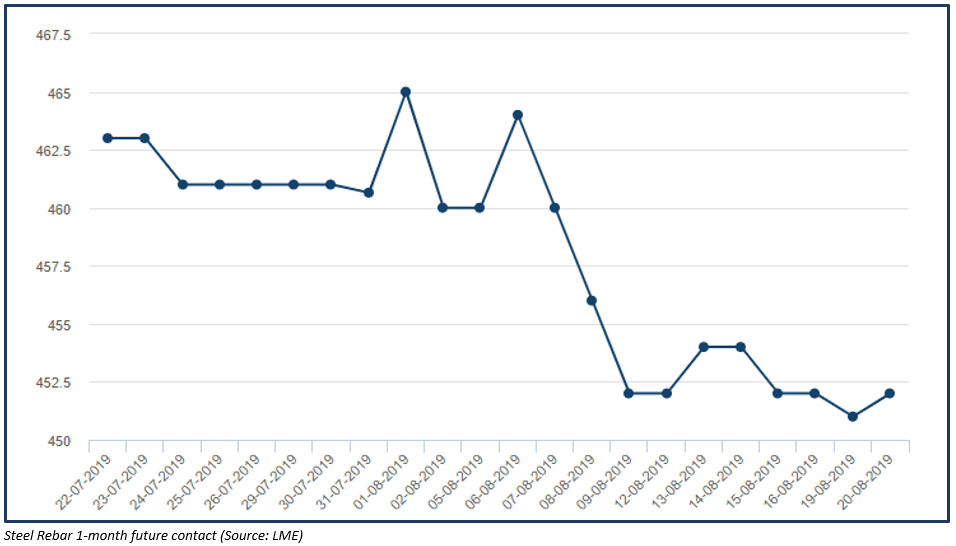
The fall in steel prices exerted pressure on the iron ore prices and reduced the demand for the commodity in China.
Would the Market Again Reach out to Steel Scrap?
Previously, iron ore prices surged to a multi-year high in the international market, which in turn, diverged the steel makers toward alternative raw material for steelmaking- steel scrap.
As per the data from Chinaâs Association of Metalscrap Utilization, China consumed 101.13 million metric tonnes of ferrous scrap during the first half of the year 2019, which in turn, underpinned the growth of 15.28 per cent from the previous corresponding period.
While, the Chinese mills consumed higher steel scarp, the production of pig iron surged by 8.4 per cent to stand at 404.21 million metric tonnes in the first half of the year 2019. The output of crude steel also expanded during the same period to 492.17 million metric tonnes, which in turn, underpinned a growth of 9.01 per cent from the previous corresponding year.
However, the iron ore prices have corrected over 33.33 per cent from its recent high post the CISA measures to curb the prices, which could further make sure that the mills donât replace the steelmaking raw material with other close substitutes such as steel scrap.
Iron Ore on Charts:
On Charts, the iron ore prices cracked post forming a double top pattern on the daily chart.
Also Read: Commodity Market In A Nutshell; Iron Ore Shows Potential Double Top
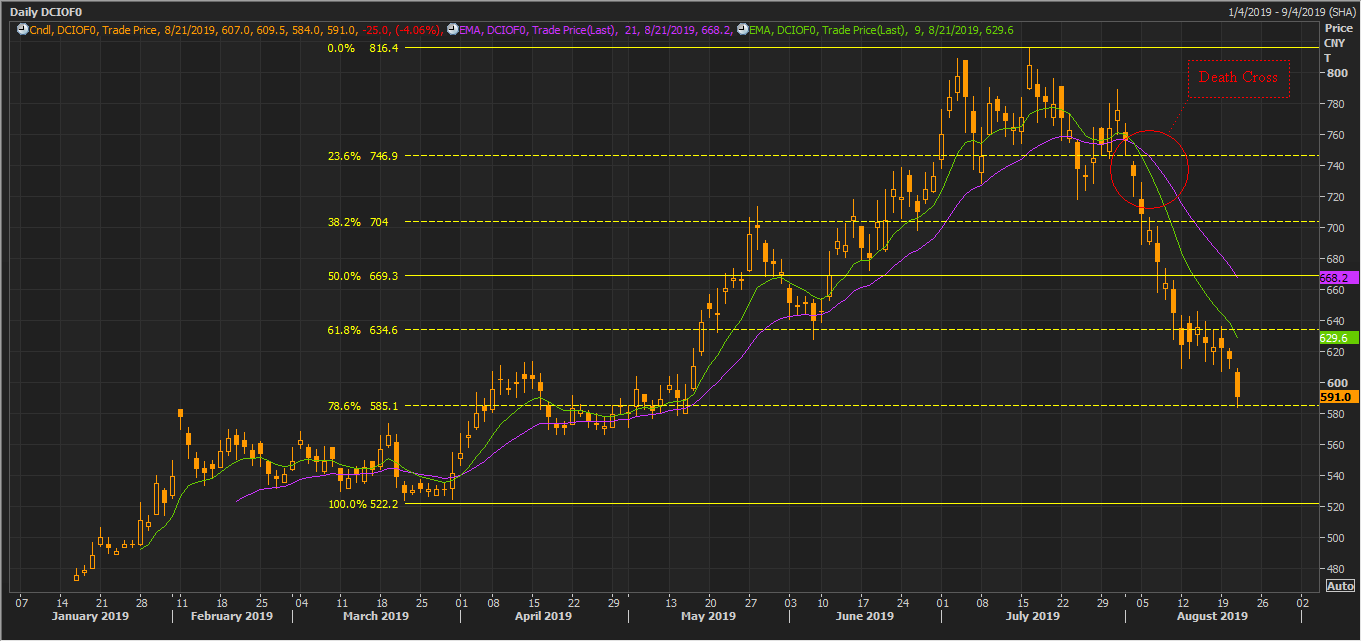
DCIOF0 Daily Chart (Source: Thomson Reuters) ©Kalkinemedia
On the daily chart, the prices have now corrected 78.6 per cent of the initial upside rally, which started from the level of RMB 522.2 and halted at the level of RMB 816.4 (DCIOU9 high price â RMB 924.50).
As per the academics, the more the price retraces from its recent peak, the higher the probability of a bounce bank. However, the retracement in the prices was followed by a death cross (bearish signal) of 9 and 21 days exponential moving average, which indicates bearish sentiments.
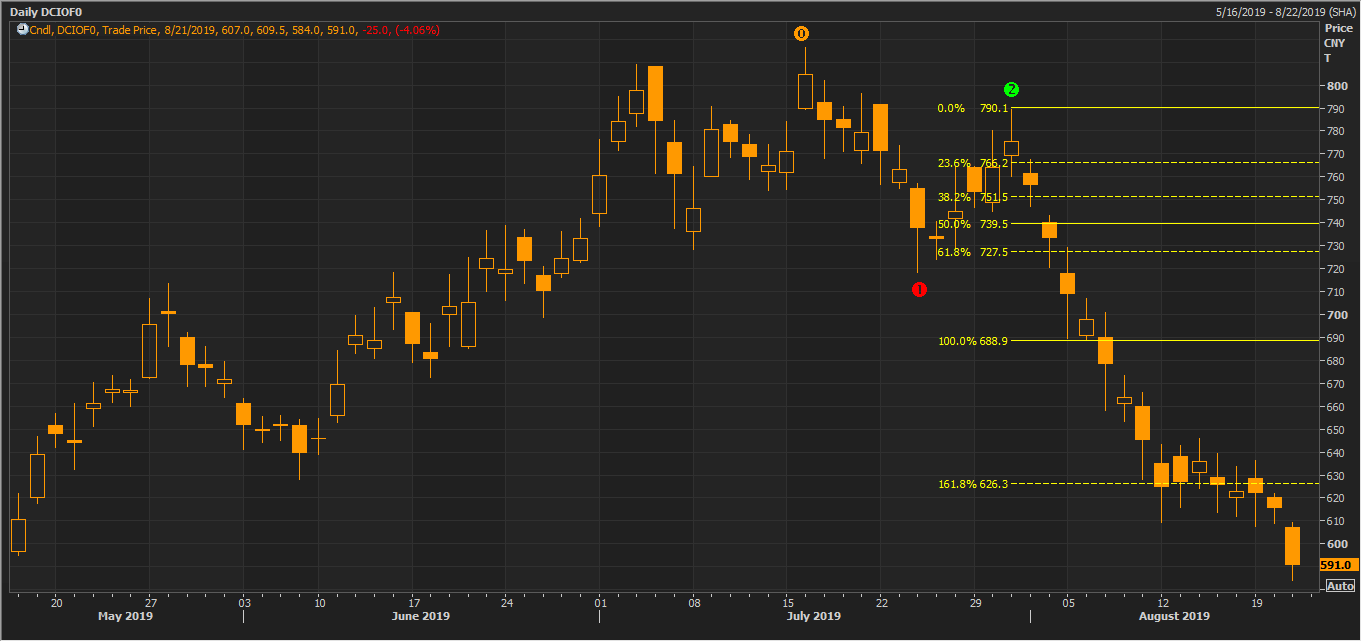
DCIOF0 Daily Chart (Source: Thomson Reuters) ©Kalkinemedia
On applying the Fibonacci series from the points marked as 0,1,2 on the chart above, we observe that the prices breached the 161.8 per cent of the projected level, which in turns suggest that the primary hurdle for prices would now be around the level of RMB 626.
Investors should monitor this level as a break and sustain above coupled with a comfortable weekly close could uplift the bull sentiments; however, failure to do so could exert further pressure on the prices.
While the iron ore prices are plunging in the global market amid weaker demand for steel due to a more uncertain economic outlook, gold prices have started consolidating in a narrow range.
Gold Scenario:
Gold prices are trading in a narrow range of A$2,197.50 to the level of A$2,261.27 from past few trading sessions. Post a bumper start in the second half of the year 2019 and a strong performance in the first half; gold prices are now losing high volatility in the prices.
Apart from the decreased volatility, the higher gold prices have witnessed a slight decrease in demand, especially from the consumer of physical gold such as Jewellery makers. The higher prices of gold had dampened the sentiments of Jewellery consumers, which in turn, exerted pressure on gold demand.
However, the current scenario of the falling interest rate and bond yields have kept the gold above its psychological level of US$1500 per ounce in the international market.
Gold on Charts:
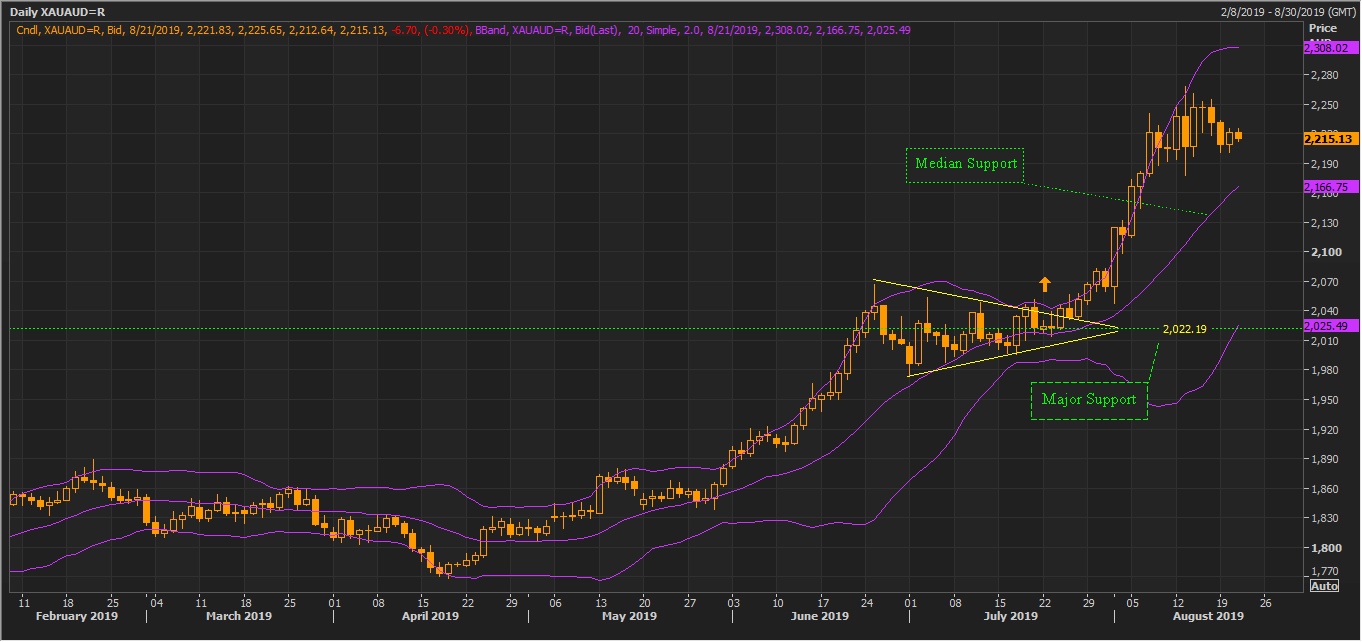
XAUAUD Daily Chart (Source: Thomson Reuters) ©Kalkinemedia
On the daily chart, gold prices breached the symmetrical triangle formation and rallied to a record high in Australia dollar terms. Now the upper band of the 14-day Bollinger would act as a resistance for the gold prices, while the median would serve as an immediate support.
The major support for the Australian dollar-denominated gold or XAUAUD is intact at A$2,022.
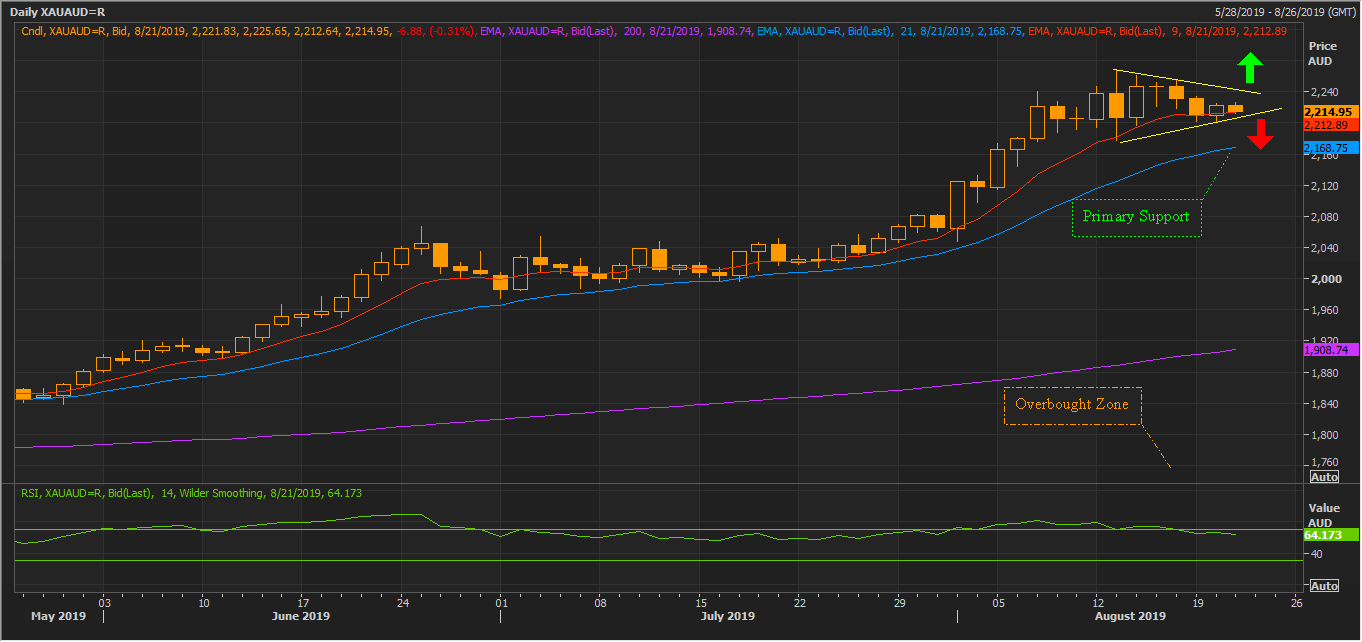
XAUAUD Daily Chart (Source: Thomson Reuters) ©Kalkinemedia
On further focusing on the consolidation range, we can observe that the gold prices are again forming a symmetrical triangle formation and the further trend would be decided once the prices either break above or below the symmetrical triangle formation.
The 14-day Relative Strength Index is currently in the overbought zone and is at 64.173. The prices are presently taking the support of 9 days exponential moving average at A$2,212.89. If the prices break below the symmetrical triangle, the prices could take the primary support at 21 days exponential moving average, which is at A$2,168.75.
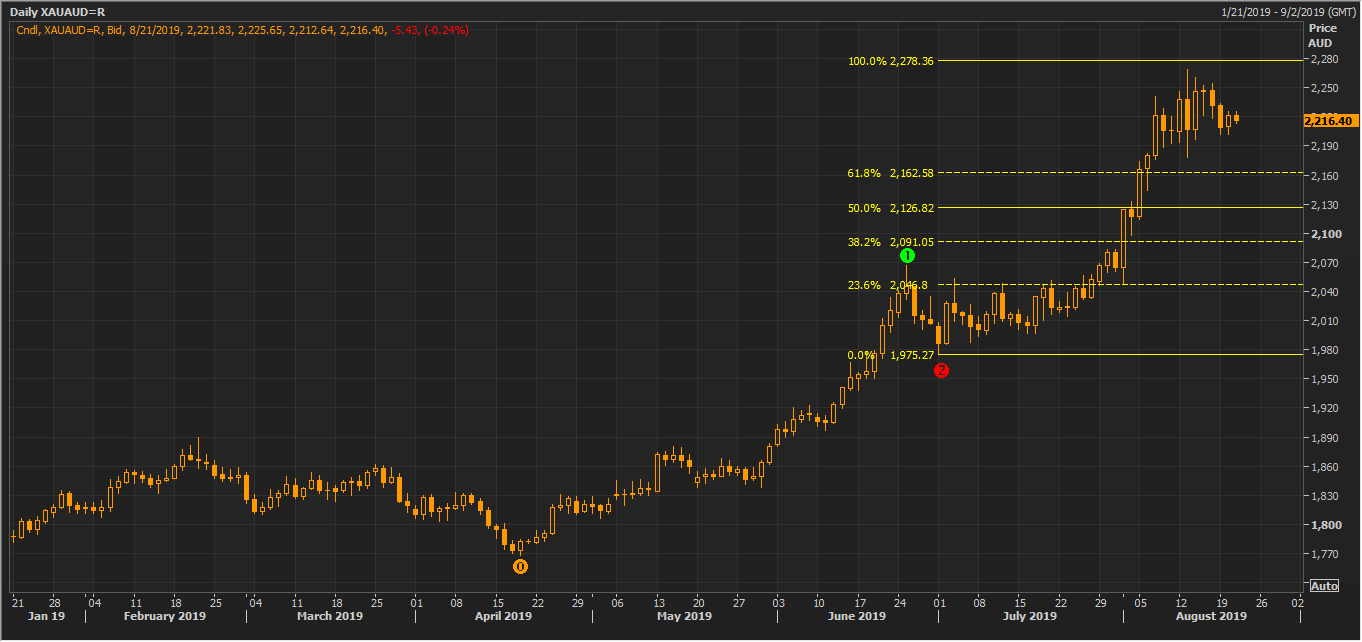
XAUAUD Daily Chart (Source: Thomson Reuters) ©Kalkinemedia
On projecting the Fibonacci series, we can observe that the prices were able to cross the level of 61.8 per cent and are currently trading in the projected range of 78.6 per cent to 100.0 per cent. The 100.0 per cent level is slightly above the record high, and the same level is acting as the hurdle for the gold prices on a daily chart.
The 100.0 per cent projected level is at A$2,278.36, which is the near-term resistance for the gold prices.
In a nutshell, the iron ore prices are trading lower in the international market over the weaker demand and falling steel prices amid global uncertainties; however, the gold prices are consolidating in a narrow range, and a break above or below the consolidation range would decide further trend for gold.
Fundamentals for gold remains steady; while a probability of a turnaround in iron ore prices is increasing; however, the investors should monitor the fundamental aspects of demand and supply for iron ore before reaching any conclusion.
Disclaimer
This website is a service of Kalkine Media Pty. Ltd. A.C.N. 629 651 672. The website has been prepared for informational purposes only and is not intended to be used as a complete source of information on any particular company. Kalkine Media does not in any way endorse or recommend individuals, products or services that may be discussed on this site. Our publications are NOT a solicitation or recommendation to buy, sell or hold. We are neither licensed nor qualified to provide investment advice.
