


What are defensive stocks?
A defensive stock is characterised by a stock providing constant dividend and stable earnings to shareholders, irrespective of the state of the overall stock market. The stock generally remains stable during different business cycles due to the constant demand of the products being offered by the company.
For instance, Woolworths Group Limited which operates in the consumer staples sector, offers necessity goods that are in demand despite the prevalent economic conditions. The products offerings of consumer staple companies include the daily requirements for food, beverages and other household items. As a result, earnings for such companies is generally stable during all economic conditions.
Besides, AGL Energy which is engaged in energy generation and sale of gas is an example of a defensive stock as its offerings are needed in all phases of the business cycle. Such companies also benefit from economic slowdown, due to lower interest rates posing lesser competition to borrowed funds.
Now let us have a look at the performance of both the stocks in detail.
Woolworths Group Limited
Woolworths Group Limited (ASX:WOW) is primarily engaged in operation of Supermarkets in Australia and New Zealand.
FY19 Financial Highlights
Financial performance of the group for the year ended 30 June 2019 is as under:
- Total group sales for the year were reported at $63,680 million, representing an increase of 3.2% on prior corresponding period.
- The company reported an EBIT of $3,553 million, that increased by 29.5% on prior corresponding period.
- NPAT attributable to the shareholders increased by 56.1% to $2,693 million in FY19.
Financial Performance from Continuing Operations were as under:
- Sales from continuing operations stood at $59,984 million, representing a normalised increase of 3.4% on pcp.
- EBIT from continuing operations was recorded at $2,724 million, rising 5.0% on prior corresponding year.
- NPAT from continuing operations stood at $1,752 million, depicting an increase of 7.2% on prior corresponding period.
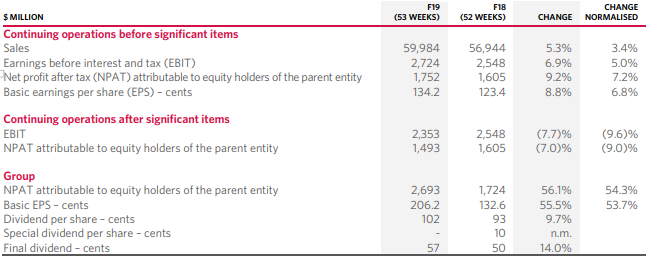
FY19 Financial Highlights (Source: Company Reports)
Progress in FY19: During the year, the company witnessed robust customer scores, especially in Q4. Sales and profit across the group improved in the second half of the year, with material improvement in momentum of Big W. The company laid solid foundations for all âXâ businesses. Group online sales during the period amounted to $2.5 billion, representing normalised growth of 32%.
Business Performance
- Australian Food: H2 comparable sales of Australian Food increased by 3.9%, that led to an increase of 3.1% in full year comparable sales. Normalised EBIT for the year increased by 3.8%. In the first eight weeks of FY20, the company has reported an approximate growth of 7.5% in comparable sales. Over the course of the financial year, sales growth is expected to be moderate. Normalised EBIT for the business was reported at $1,857 million, as compared to $1,757 million in prior corresponding period.
- New Zealand Food: The business witnessed a strong second half with comparable sales growth of 3.6%. Normalised EBIT stood at $277 million, up 2.6% on prior corresponding period value of $262 million. The company reported an improvement in customer metric on the prior year and delivered strong normalised online sales growth of 40%.
- Endeavour Drinks: As a result of settled weather and early progress on the refreshed strategy, the business witnessed an improvement in sales in the second half. Endeavour drinks EBIT stood at $474 million, down by 9.7% on normalised basis, reflecting the impact of investment to position the business for future success.
- BIG W: Normalised sales increased by 4.2%, with strong H2 comparable sales growth of 7.3%. The business saw an improvement in apparel sales in the second half. Loss before interest and tax stood at $85 million, which was in line with the guidance range.
- Hotels: Normalised sales witnessed an increase of 1.8%. The business saw an improvement in comparable growth in the second half on the back of growth in Bard, Food and Accommodation. Normalised EBIT for Hotels business was reported at $261 million, declining marginally on prior corresponding period.
Dividend Story
FY19 dividend per share amounted to 102 cents, representing an increase of 9.7% on prior corresponding year dividend of 93 cents per share. Although, the amount of dividend paid over a period of 5 year has depicted mixed growth trends, the company has been paying regular returns to shareholders.
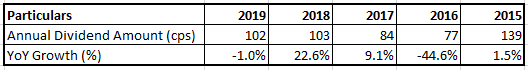
Historical Dividend (Source: Company Reports)
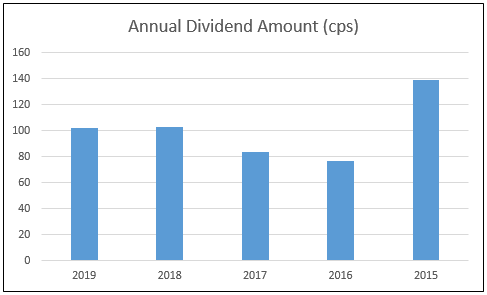
Dividend Chart (Source: Company Reports)
Stock Performance: The stock of the company generated returns of 4.41% and 14.27% over a period of 1 month and 3 months, respectively and has a market capitalisation of $46.46 billion. Currently, the stock is trading at a market price of $36.8300, up 0.017% on 18 September 2019.
AGL Energy Limited
AGL Energy Limited (ASX: AGL) is involved in gas storage, electricity generation, and the sale of gas and electricity.
FY19 Financial Results
- During the year ended 30 June 2019, the company reported statutory profit after tax amounting to $905 million, down 43% on prior corresponding period.
- Underlying profit after tax was reported at $1,040 million, rising 2% on prior corresponding year.
- Statutory earnings per share stood at 138.0 cents, down 43% on prior corresponding period. Underlying earnings per share were reported at 158.6 cents, up 2% on pcp.
- ROE for the period went down by 0.6 percentage points to 12.5%.
- During the year, the company reported net cash from operating activities amounting to $1,599 million, down 25% on prior corresponding period.
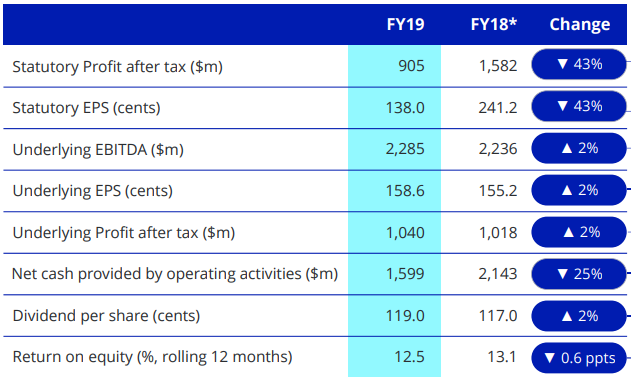
Financial Summary (Source: Company Presentation)
Key Highlights:
- Performance in FY19 reflected the flexibility and quality of wholesale electricity generation business, characterised by lower electricity prices for customers and increased investment in affordability programs and plant availability.
- The period saw continued investment in existing generation fleet and progress in construction of the Barker Inlet gas-fired power station in South Australia.
- Over the course of the year, customer numbers increased with a reduction in the levels of customer churn.
Share buy-back Update: Over a period of 12 months from 23 August 2019, the company has put forward its intention to undertake an on-market buy-back of up to 5% of its issued share capital. This will enable the company to return excess liquidity to shareholders.
Acquisition: During FY19, the company agreed on the acquisition of Perth Energy Holdings Limited from Infratil Limited for a value of up to $93 million. Perth Energy comprises of a 120 MW Kwinana Swift Power Station, electricity sales of 1,400 GWh and an emerging gas retail business. The acquisition is expected to be a strong strategic fit for the company for WA expansion. The completion of the transaction was reported on 2nd September 2019.
Dividend: Strong earnings during the year supported dividend growth with FY19 dividend per share amounting to 119 cents, up by 2 cents per share on previous yearâs dividend of 117 cps. Final dividend of 64.0 cents per share is payable on 20 September 2019. Over the period covering FY15 to FY19, the company has witnessed continuous upward movement in amount of dividend paid. CAGR growth in dividend over the period of 5 years stands at 17%.
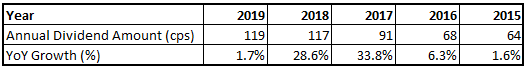
Historical Dividends (Source: Company Presentation)
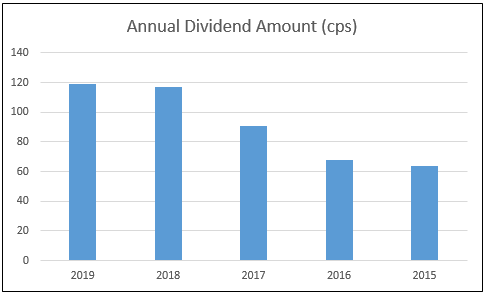
Dividend Chart
FY20 Guidance:
Underlying Profit after tax for FY20 is expected to be in the range of $780 - $860 million, which represents a reduction against FY19 due to the following factors:
- Outage of Unit 2 at AGL Loy Yang until December 2019
- YoY increase of approximately $70 million in depreciation expense
- Lower wholesale prices for electricity and renewable energy generation certificates, increase in fuel costs and other ongoing operating headwinds.
Stock Performance: The stock of the company generated negative returns of 13.17% over a period of 6 months and has a market capitalisation of $12.45 billion. Currently, the stock is trading at a market price of $18.790, down ~1% on 18 September 2019.
Disclaimer
This website is a service of Kalkine Media Pty. Ltd. A.C.N. 629 651 672. The website has been prepared for informational purposes only and is not intended to be used as a complete source of information on any particular company. Kalkine Media does not in any way endorse or recommend individuals, products or services that may be discussed on this site. Our publications are NOT a solicitation or recommendation to buy, sell or hold. We are neither licensed nor qualified to provide investment advice.
