

Crude oil prices tumbled amid trumpâs tweet over the U.S-China trade relation. The prices of Brent Spot cracked from the level of US$64.62 to the level of US$60.12 on 1 August 2019, a drag down almost 7 per cent in a single trading session. Post the drop, the prices are revolving around US$61.
In his recent tweets, the United States President mentioned that the U.S. representatives returned from China, where they had constructive talks concerning the future of the trade deal between the United States and China. China turned down the deal and expressed a will to re-negotiate the deal terms prior to signing.
China previously agreed to buy a large amount of U.S. agriculture products; however, the nation failed to do so. The chances of the trade tiff escalation erupted as China decided to stop exporting Fentanyl- a medical drug to the United States.
Over the Chinaâs stand, the United States president expressed grief and said that the United States would levy a 10 per cent on US$300 billion worth of additional goods from 1 September 2019, which does not include the US$250 billion worth of Chinese products already tariffed at 25 per cent.
Crude and Global fear:
The U.S-China trade relation, which previously estimated by the market participants to improve over time, witnessed a turnaround, which in turn, raised suspicion among the energy investors over the long-term global demand scenario. The crude oil market saw some sharp shorts built up recently, and the prices fell.
Crude Fundamentals Check:
Crude Inventory Change:
The total U.S. commercial crude oil inventory (excluding Strategic Petroleum Reserve) stood at 436.5 million barrels post a recent decline of another 8.5 million barrels on the week ended 26 July 2019.
The United States has consistently reduced its commercial inventory post addition of over 6 million barrels in June 2019, and the recent decline marked the ninth straight week of reduction in the commercial oil inventory.
At the level of 436.5 million barrels, the commercial oil inventory in the United States reached the five years average level for this time of the year.
Production, import and Export Scenario:
OPEC Production:
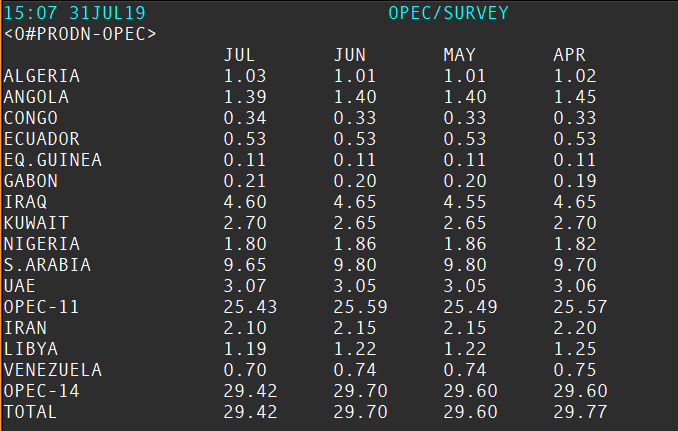
(Source: Thomson Reuters)
OPEC members recently reduced the overall production level in July 2019, and the cartel is adjusting the production in line with the global demand. OPEC members have recently decided to curb 1.2 per cent of total global demand to support the crude oil prices.
U.S. Domestic Oil:
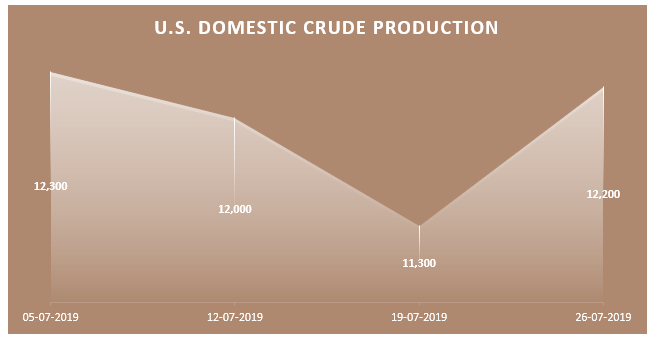
(Data Source: EIA)
The United States domestic production has witnessed a sharp increase to stand at 12,200 thousand barrels/ day (or bpd) for the week ended 26 July 2019, which in turn, underpinned a rise of approx. 8 per cent as compared to the previous corresponding week production level of 11,300 thousand bpd.
Post a decline in the mid-July, the domestic production of oil in the United States witnessed a recovery and the production almost reached the production level seen by the United States at the beginning of the month.
U.S. Import and Exports:
Net Imports:
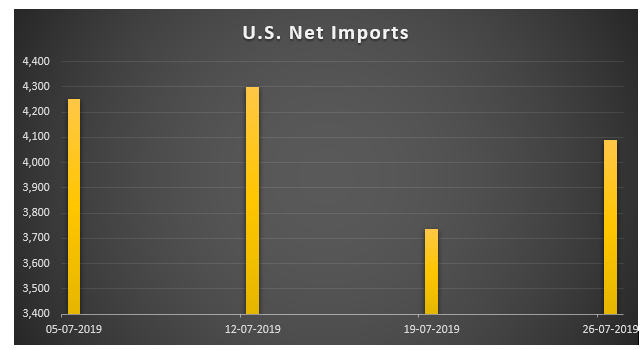
(Data Source: EIA)
Despite higher domestic production, the overall imports in the United States are increasing amid fall in export, which in turn, could suggest that domestic consumption is high in the United States.
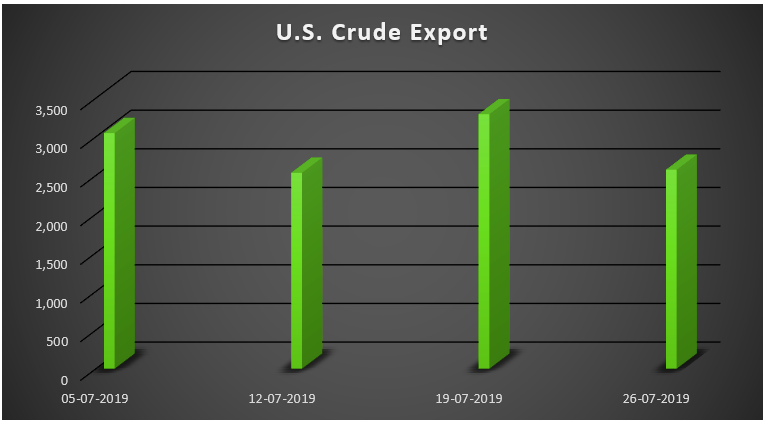
(Data Source: EIA)
As per the data, the total exports from the United States stood at 2,574 thousand barrels a day for the week ended 26 July 2019, which was over 21.80 per cent down as compared to the previous corresponding week.
In a nutshell, the OPEC is keeping the production lower, but the United States domestic production is increasing; however, the domestic consumptions have kept the export lower from the United States, and the United States could further inch up the imports to support the local demand.
If that happens, the crude oil prices could experience a turnaround in the near-term; however, the overall global consumption scenario would decide the long-term trend for the oil prices.
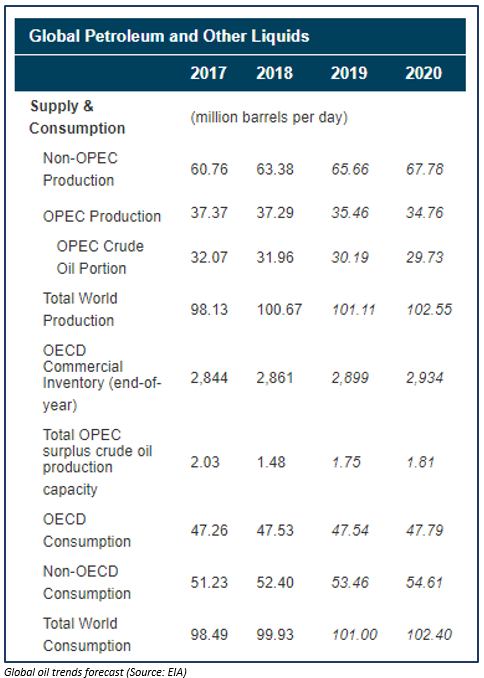
The EIA anticipates that the OPEC production would decline over time, and the overall global production would witness a slight change in 2019. However, the EIA also estimates that the worldwide consumption would remain in line with the output. However, overall production would remain slightly above world consumption in 2019.
ASX-Listed Oil producers:
Over, the decline in crude oil prices, the oil companies on ASX have taken a hit. Oil Search- an Australian Securities Exchange-listed (ASX: OSH) oil explorer and producer felt the pressure from falling oil prices and the share of the company plunged on ASX on Friday 02 August 2019. During todayâs session, the prices have shown slight recovery and are currently trading at A$7.150 (as on 5 August 2019 02:40 PM AEST)
The shares of the company are moving in a downtrend from the level of A$8.300 (Dayâs high on 24 April 2019) over the fall in oil price scenario.
Likewise, many such players who track the oil price movement are plunging on ASX. Let us take a look over how the crude oil prices are dragging and pulling the oil players.
Crude Oil and Oil Search Limited (ASX: OSH)
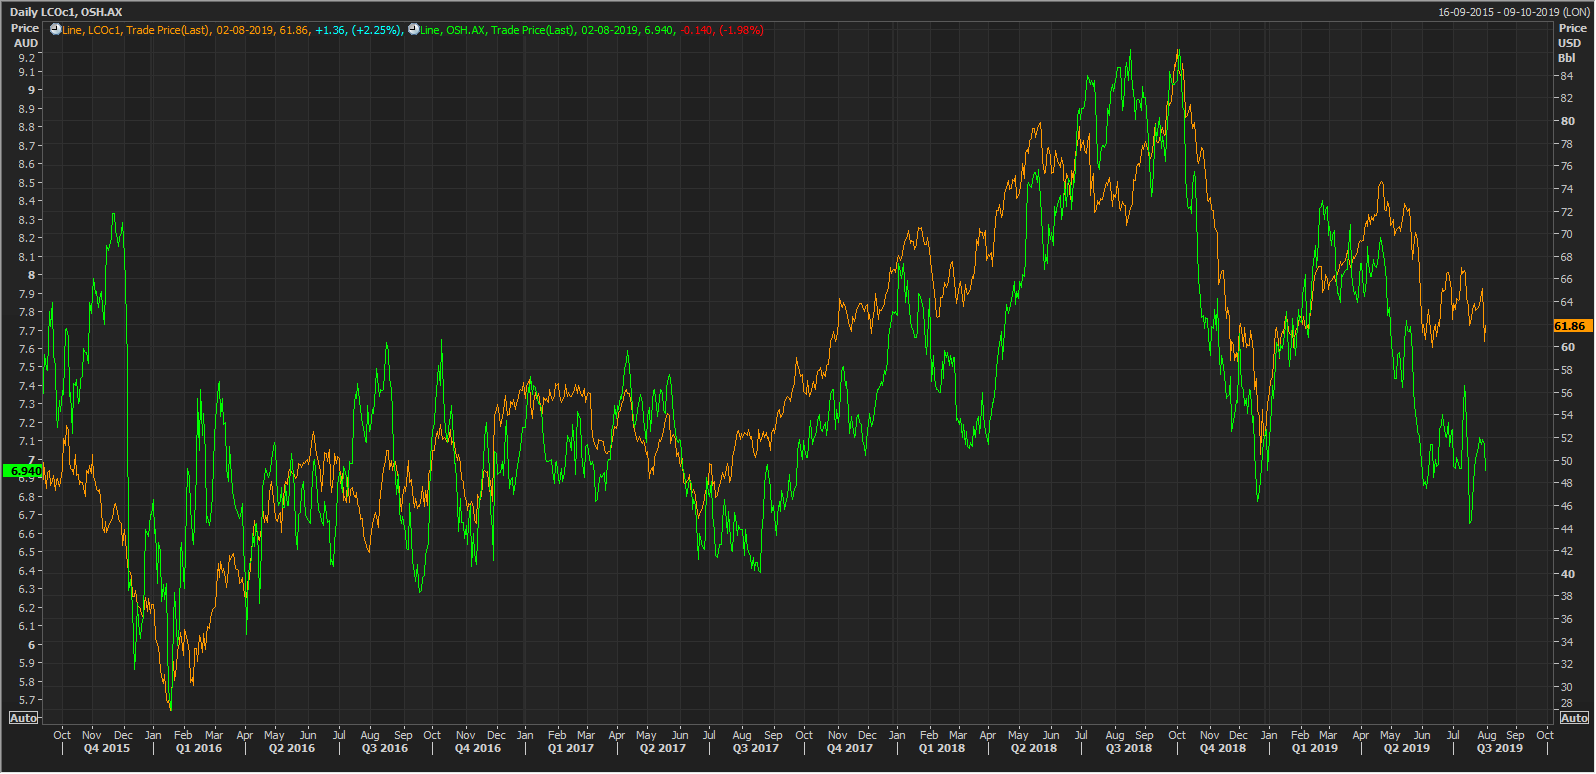
LCO and OSH daily Chart (Source: Thomson Reuters)
As we can see from the chart above, the oil explorer OSH is closely monitoring the long-term trend in oil prices.
Why Do Oil Producers Trace Oil Prices?
The oil explorers rely on high commodity prices to generate a healthy balance sheet. When the crude oil prices fall in the market; it hampers the sales realisations of the company; thus, a discounted oil price, discounts the companyâs share and in turn, drags the valuation down.
However, despite the above fact, the oil companies, at times show divergence from the oil prices amid fundamentals of the company. Some oil explorers thus secure sales or hedge their sales in the market to avoid volatility, which in turn, causes a near-term divergence between the oil explorer and oil prices.
Over the long-term as the income of the company decides the valuation, and revenue of oil producers and explorer is directly related to the oil price, the share prices of the oil explorers merge with the trend of the underlying commodity over the long-term.
ASX-listed oil explorer- Origin Energy Limited (ASX: ORG) recently produced one such example, where the higher commodity prices in the first quarter of the year 2019 gave the company a bumper payoff from its Australian Pacific LNG prospect.
LCO and Santos Limited (ASX: STO):
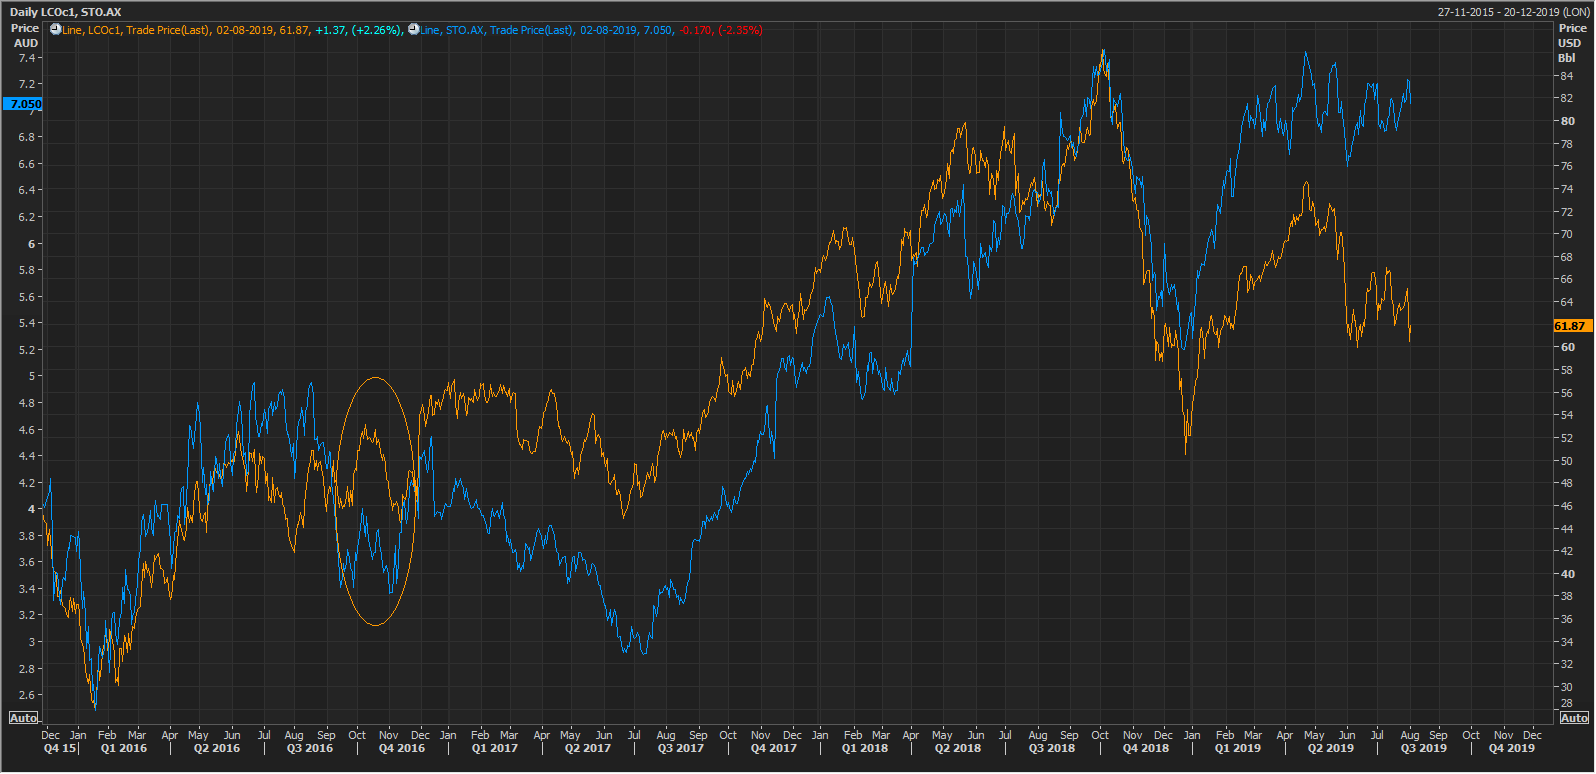
(Source: Thomson Reuters)
One such short-term divergence is shown on the chart above through an orange elliptical shape.
Disclaimer
This website is a service of Kalkine Media Pty. Ltd. A.C.N. 629 651 672. The website has been prepared for informational purposes only and is not intended to be used as a complete source of information on any particular company. The above article is sponsored but NOT a solicitation or recommendation to buy, sell or hold the stock of the company (or companies) under discussion. We are neither licensed nor qualified to provide investment advice through this platform.
