


Crude oil prices are showing promising uprise amid a decline in the United States crude oil inventory and over the fall in the United States domestic production, which in turn, prompted the United States to rely on higher imports to meet the local demand and supported the oil prices in the global market.
The prices of Brent Oil Futures soared from the level of US$62.59 (Dayâs low on 24 July 2019) to the present level of U$65.28 (as on 31 July 2019 03:00 PM AEST), up by approx. 4.30 per cent from the low level of US$62.59.
U.S. Weekly Crude Inventory Change:
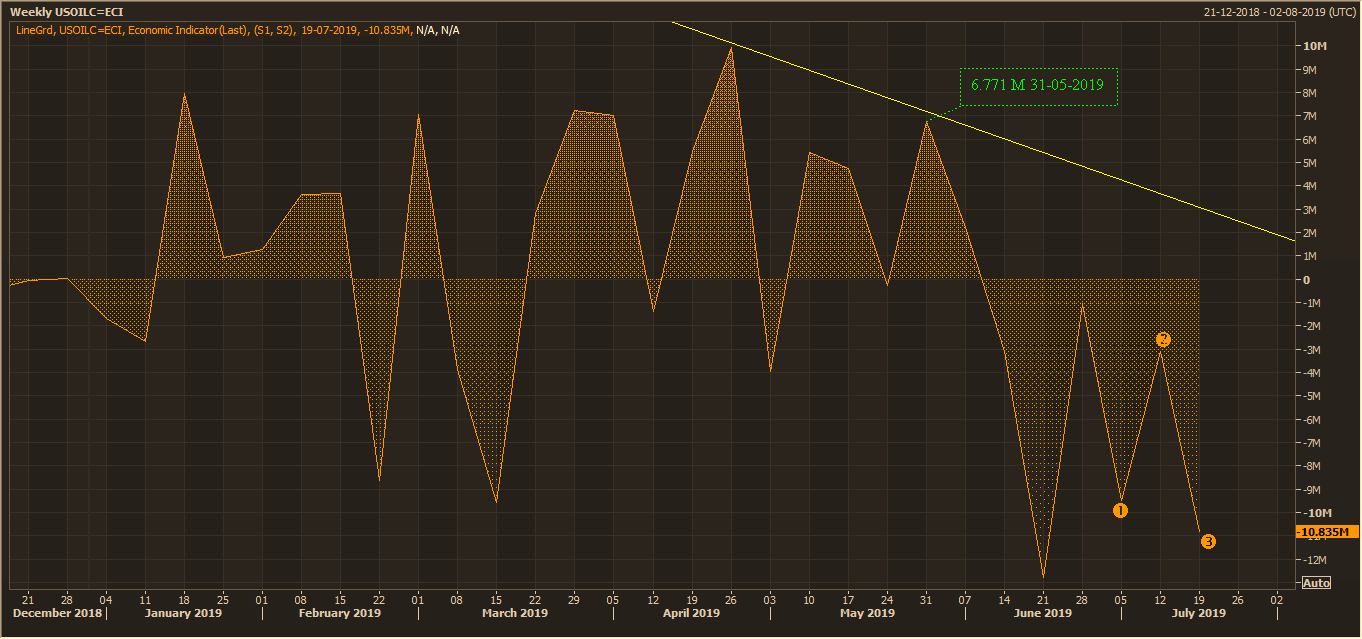
U.S. Weekly Crude Inventory Change (Source: Thomson Reuters)
The United States is reducing the crude oil inventory (excluding strategic petroleum reserves) post a recent addition of net 6.771 million barrels for the week ended 31 May 2019, and for the week ended 19 July 2019, the United States reduced the domestic inventory by another 10.835 million barrels, which in turn, marked an eighth consecutive decline from its top addition of 6.771 million barrels.
In July, the United States has so far reduced the inventory for the third consecutive week, which ended on 19 July 2019. The inventory change report for the previous corresponding week ended 26 July 2019 is still pending and would be released tomorrow around 12:30 AM AEST.
The overall commercial crude oil inventory excluding the strategic petroleum reserve stood at 445.0 million barrels.
Could the U.S. Domestic Production Inch up?
The domestic production of oil in the United States plunged for the second consecutive week for the week ended 19 July 2019, which, in turn, fanned the oil prices as the United States opted for the external supply.
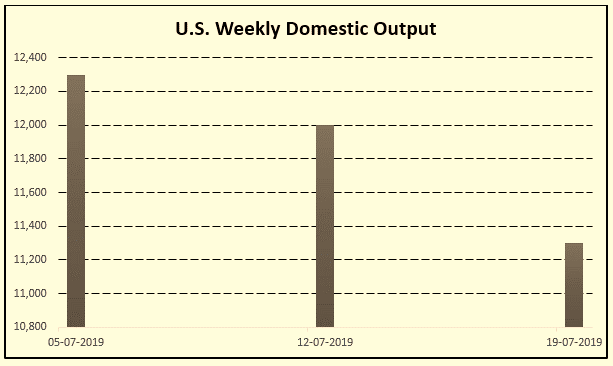
As per the data, the domestic production slumped by 700k barrels per day and stood at 11,300k barrels per day for the week ended 19 July 2019 against the previous corresponding week per day production of 12,000k.
The current domestic production is over 8 per cent down against the production capacity of 12,300k barrels per day at the beginning of the month or for the week ended 5 July 2019.
The fall in weekly domestic output dragged down the monthly as well as the cumulative daily average of the United States domestic production. As per the data, the four weeks (monthly) production average in the United States stood at 11,950k barrels per day for the week ended 19 July 2019, down by over 1.64 per cent against the previous corresponding week monthly average of 12,150k barrels per day.
Likewise, the cumulative daily average fell in the United States to stand at 12,083k barrels per day for the week ended 19 July 2019, against the previous corresponding week daily average of 12,112k barrels per day.
Oil Imports in the United States:
The fall in domestic production turned the United States towards the international market and the weekly average imports inched up to the level of 7.0 million barrels per day for the week ended 19 July 2019, up by 0.20 million barrels per day against the previous corresponding week import average of 6.8 million barrels per day.
However, despite a higher import, the net import in the United States plunged amid a higher export activities, and the United States exported over 53 per cent of the total import for the week ended 19 July 2019.
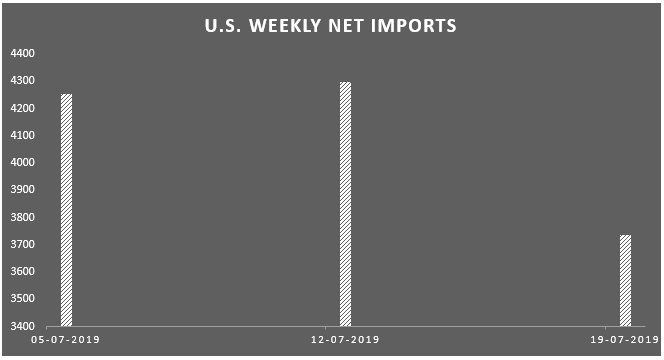
The United States net imports stood at 3,736k bpd for the week ended 19 July 2019, down by over 13 per cent as compared to the previous corresponding week import of 4,298k barrels per day.
The fall in the weekly net imports could not drag down the four weeks (or monthly average) as the previous week higher import supported the average. As per the data, the four weeks net import average stood at 4,221k bpd, against the previous corresponding four weeks average of 4,008k barrels per day.
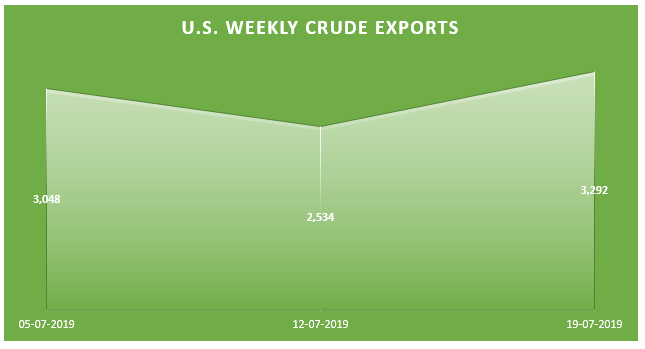
Export Figures:
The export from the United States inched up and stood at 3,292k bpd, up by approx. 30 per cent as compared to the previous corresponding week export of 2,534k bpd.
Whatâs Ahead?
In a nutshell, the domestic production declined, and the export increased, which in turn, reduced the net imports; however, the four weeks net import average increased, which might suggest that the United States is relying on the external supply to meet the local demand.
However, the high exports suggest that the domestic demand is oblique and would require further investigation, and investors should pay close attention to the United States and global oil demand scenario to reckon the direction of prices ahead in the future.
The overall figures are in the doldrums and somewhat uncertain, and each aspect would require a further lens to gauge the price direction ahead.
The plunge in the United States domestic output and a high import supported the crude oil prices, which in turn, supported the ASX-listed energy players, and while the crude oil prices are experiencing a turn-around, the ASX-listed Origin Energy and Sundance Energy reported their respective June 2019 quarter figures.
Origin Energy Limited (ASX: ORG)
ORG announced its June 2019 quarterly production report on 31 July 2019, in which the company mentioned that the revenue from the Australia Pacific LNG inched up by 36 per cent in the financial year 2019.
FY2019 Highlights:
During FY2019, ORG APLNG commodity revenue stood at A$2,788.6 million, up by 36 per cent as compared to the previous financial year revenue of A$2,054.4 million. However, the production of the integrated gas remained almost unchanged and stood at 254.7 petajoules in FY2019 against the FY2018 production of 253.6 petajoules.
The company sold 1 per cent lower product during FY2019, which stood at 253.6 petajoules equivalent against the FY2018 level of 254.9 petajoules equivalent.
Despite a lower production and a lower sales in FY2019, the revenue increased by 36 per cent due to the higher commodity prices in the international market in the year 2019 as compared to the previous corresponding year.
The realisation of high commodity prices brought net cash from APLNG of A$943 million during the FY2019, which was 160 per cent higher than the previous year net cash from APLNG of A$363 million.
June 2019 Quarter Highlights:
During the June 2019 quarter, the company produced 64.0 petajoules of integrated gas, which was about 1 per cent higher than the previous quarter. ORG managed to sell 62.3 petajoules equivalent during the June 2019 quarter, down by 2 per cent as compared to the last quarter.
During the second quarter of the year 2019, oil prices plunged as compared to the first quarter of the year 2019, which in turn, reduced the total commodity realised amount for the company. The June 2019 commodity revenue stood at A$643.4 million, down by 16 per cent as compared to the previous quarter revenue of A$763.9 million.
However, the capital expenditure for the quarter remained unchanged to stand at A$77 million.
During the June 2019 quarter, the electricity sales plunged by 6 per cent to stand at 8.7TWh; while the natural gas sales soared by 11 per cent to stand at 65.1 petajoules, compared to previous quarter.
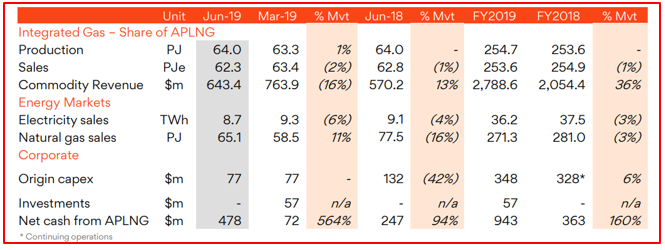
(Source: Companyâs Report)
The shares of the company ended the dayâs session today on ASX at A$7.940, up by 1.018 per cent as compared to its previous close.
Sundance Energy Australia Limited (ASX: SEA)
Sundance announced on 31 July 2019 in its June 2019 quarterly update that the companyâs quarterly sales reached the high end of the sales volume guidance. As per the data, the average sales during the June 2019 quarter stood at 13,500 barrels of oil equivalent per day, while the sales volume guidance stood in the range of 13,500-14,000 barrels of oil equivalent per day.
June 2019 Quarter Highlights:
The cumulative sales volume during the June 2019 quarter stood at approx. 1,264,031 barrels of oil equivalent. The sales volume comprised of 749,611 barrels of oil, 232,807 barrels of natural gas liquids and 1,689,678k cubic feet of natural gas.
The overall sales witnessed an increase of nearly 59 per cent oil by volume. The YTD cumulative sales volume stood approx. 2,371,253 barrels of oil equivalent and the average daily sales stood at 13,101 barrels of oil equivalent per day.
Apart from the higher sales volume, the company progressed through various development activities which include the drilling of 4.0 net well HT Chapman and 4.0 gross well H Harlan Bethune pads in Live Oak County.
SEA and its midstream partner progressed and completed the CGP-41 gas processing plant capacity expansion through the installation of two additional compressors.
During the June 2019 quarter, the companyâs Borrowing Base availability stood at US$170.0 million, which in turn, underpinned a 39 per cent increase in the Borrowing Base.
The shares of the company ended the dayâs session today on ASX at A$0.185, down by 7.5 per cent as compared to its previous close.
Disclaimer
This website is a service of Kalkine Media Pty. Ltd. A.C.N. 629 651 672. The website has been prepared for informational purposes only and is not intended to be used as a complete source of information on any particular company. Kalkine Media does not in any way endorse or recommend individuals, products or services that may be discussed on this site. Our publications are NOT a solicitation or recommendation to buy, sell or hold. We are neither licensed nor qualified to provide investment advice.
